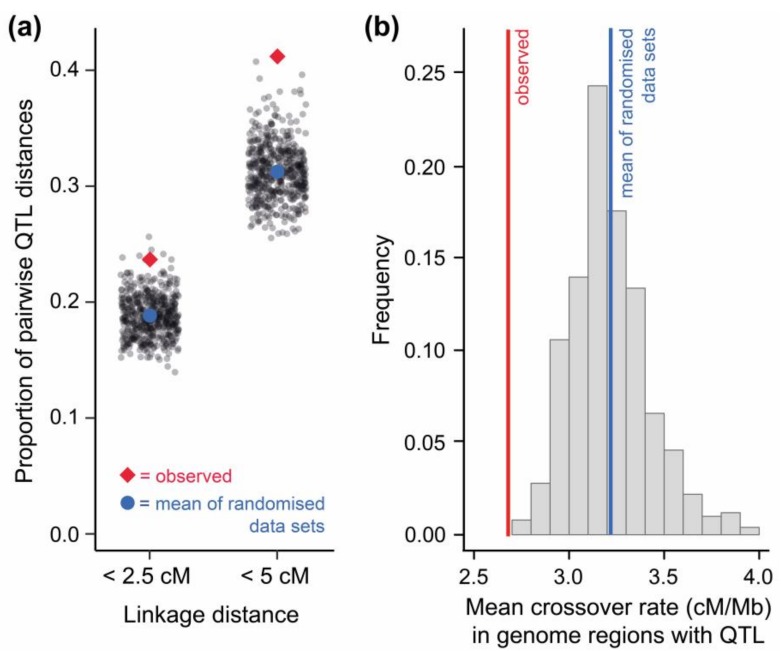
Figure 2.
Genomic clustering of stickleback quantitative trait loci (QTL), and the relevance of low crossover genome regions therein. (a) The proportion of pairwise QTL distances shorter than 2.5 and 5 cM is higher among real QTL than among an identical number of QTL placed randomly within the stickleback genome (total number of such ‘randomized data sets’ = 500; gray dots indicate the extent of clustering in a single randomized data set). To account for the possibility that one locus may affect several traits (pleiotropy), only unique QTL positions (N = 336) were considered for this analysis (Figure S1 presents an analysis including redundant QTL positions). (b) The average crossover rate in the genome regions harboring the real QTL is lower than in genome regions of QTL placed randomly within the stickleback genome (histogram indicates the frequency of mean crossover rates in 500 randomized data sets). Notably, heterogeneity in gene density across the stickleback genome was considered when generating the randomized QTL data sets for both (a) and (b) (see Methods S1).

