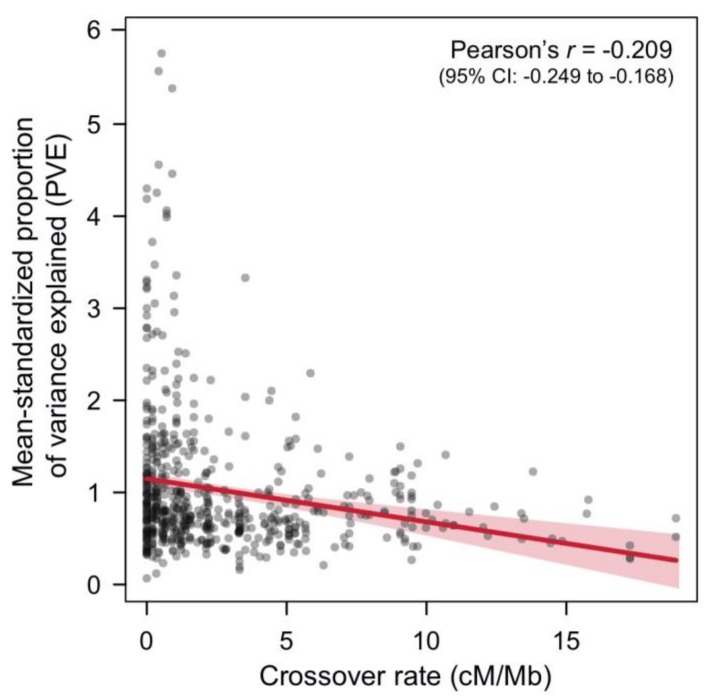
Figure 3.
An analysis in threespine stickleback suggests a widespread detection bias of QTL towards genome regions with low crossover rates. Shown is the association between the proportion of phenotypic variance explained (PVE; standardized among studies by dividing the PVE of each QTL by the study’s mean PVE) and the crossover rate for stickleback QTL implicated in adaptive trait variation (see also Table S1). Each gray dot represents one QTL (N = 602). In the top right corner, Pearson’s r correlation between standardized PVE and crossover rate along with its 95% bootstrap confidence interval (CI) are given. The linear regression fit including the 95% confidence bands are visualized in red.

