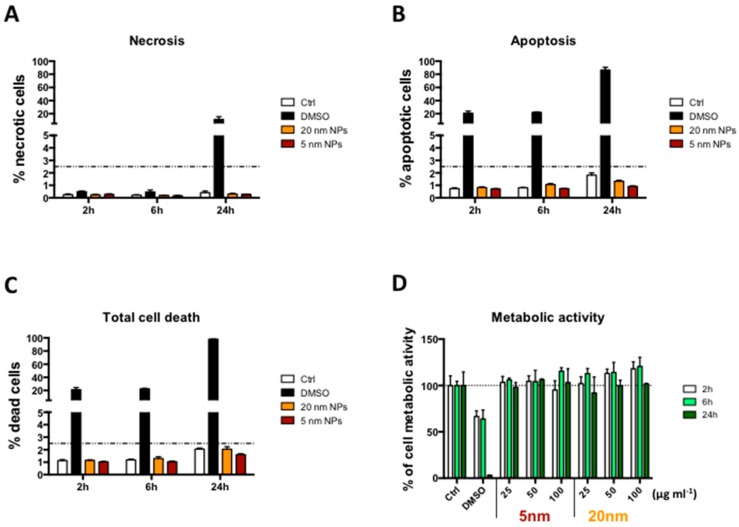
Figure 1.
Cell viability. (A–C) Viability of THP-1 cells after 2, 6 and 24 h exposure to 50 μg/mL PtNPs. Control columns represent untreated cells. Necrotic, apoptotic and total dead cells were evaluated by flow cytometry using the Annexin V/PI assay; (D) Cell metabolic activity of THP-1 cells after 2, 6 and 24 h exposure to increasing doses of PtNPs evaluated by WST-8 assay. 10% DMSO was used as positive control in all the experiments. Data are expressed in percentage relative to untreated control cells (empty columns).

