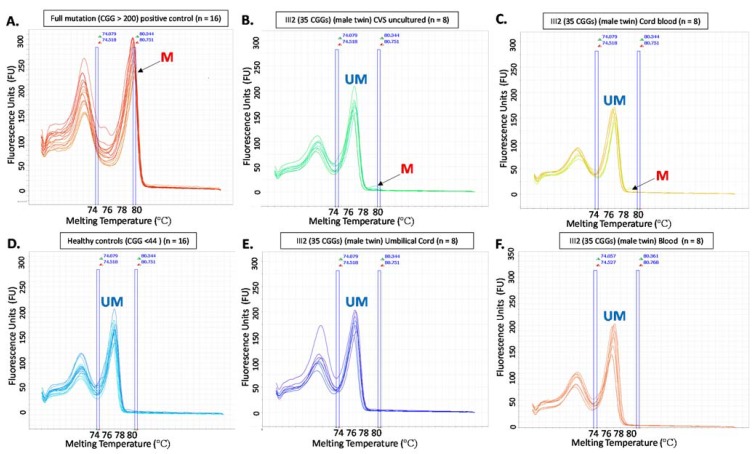
Figure 3.
High resolution melt derivative plots from Methylation Sensitive Quantitative Melt Analysis (MS-QMA) analysis of Fragile X-Related Epigenetic Element 2 (FREE2) methylation in the male twin (III-2). Derivative plots in pre and postnatal tissues (A–F) represent cluster results based on similarities of melt curve placement and shape as determined using the Applied Biosystems® High resolution Melt Software (Thermo Fisher Scientific, Global). Positive and negative controls (A) and (D) have been included for comparison with the results for the male twin’s samples (B, C, E and F), providing details about the presence or absence of the abnormally methylated (M) and unmethylated (UM) FMR1 alleles. The numbers above each panel represent technical replicates. Note: for each plot X-axis represents melting temperature, while y-axis represents fluorescence released, with each fluorescence unit (FU) equal to 1000 units generated by the Applied Biosystems ® High resolution Melt Software (Thermo Fisher Scientific, Global).

