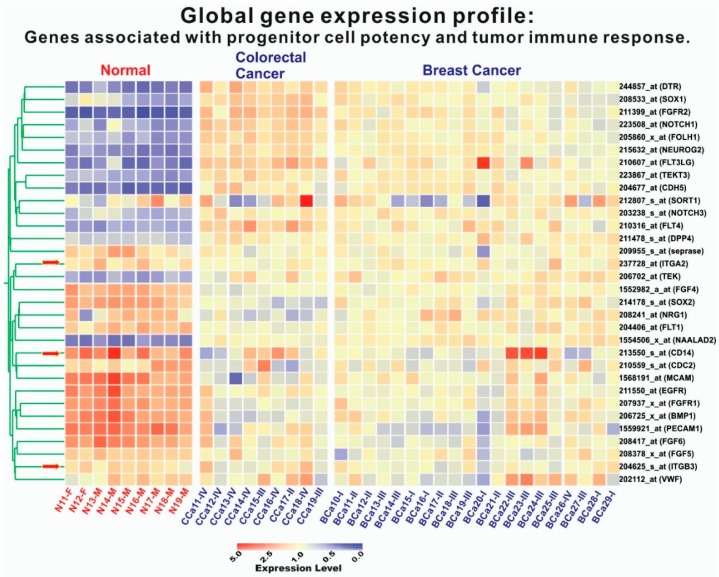
Figure 6.
Expression of tumor-progenitor-associated genes in iCTCs isolated by CAM from blood of patients with CRC and breast cancer. Global gene expression profiling of circulating cells isolated by Vita-Cap™ from 9 healthy subjects, 9 CRC patients, and 20 patients with breast cancer. Columns represent catalogues of cell samples analyzed: circulating Normal (N) cells isolated from healthy donors with suffix M for Male and F for Female; CCa are circulating Colorectal Cancer (CCa) cells and BCa are circulating Breast Cancer (BCa) cells with suffixes I–IV being stages of the disease. Colorgram depicts high (red) and low (blue) relative levels of gene expression. Red arrows indicate the three internal control genes that exhibited no difference between normal and cancer cell samples.

