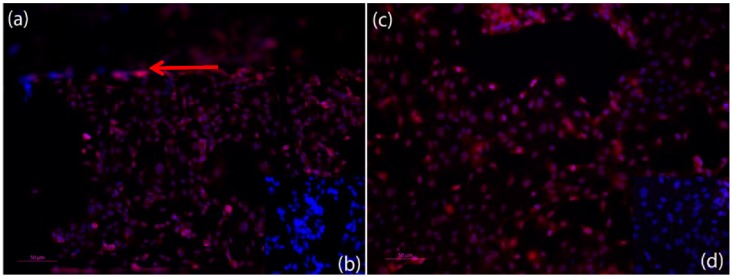
Figure 5.
Fluorescent microscopic photos of anti-VE-Cadherin, Cy3 (red) immunofluorescence staining of HPAEC endothelial cells in the microfluidic device after finishing an experiment (nuclei stained with Hoechst) (blue). (a) Anti-VE-Cadherin Staining of the HPAEC endothelial cells within the microfluidic channel after an experiment. Red arrow shows edge of channel. VE-Cadherin can be detected on the surface of all endothelial cells and shows adherence junction expression; (c) Anti-VE-Cadherin staining of the HPAEC endothelial cells on top of the porous membrane of the microfluidic device after an experiment. VE-Cadherin can be detected on the surface of all of the endothelial cells and shows adherence junction expression. (b,d) Negative control for (a,c) show that method was conducted appropriately. Dilution of antibodies: 1st antibody anti VE-Cadherin 1:200, and 2nd antibody Cy3 anti rabbit 1:500). Scale bar: 50 µm.

