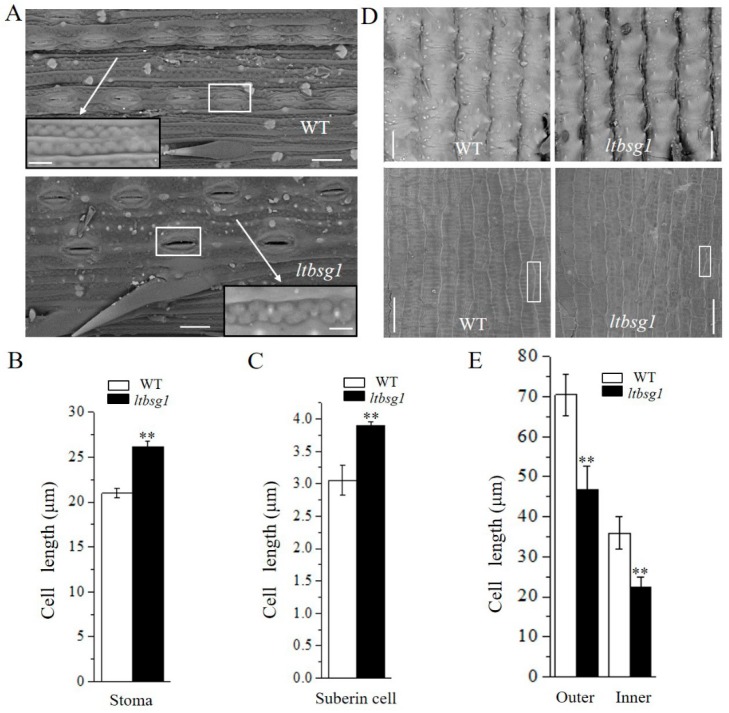
Figure 2.
The effect of LTBSG1 on top branch and grain development. (A) The scanning electron microscopic analysis of the top branch surfaces of WT and mutant ltbsg1. Bars = 20 μm. The white frames indicated the stoma and the white arrows indicated the magnified views of suberin cell. Bars = 5 μm; (B) The length of stoma in top branch surfaces of WT and mutant ltbsg1; (C) The length of suberin cell in top branch surfaces of WT and mutant ltbsg1; (D) The scanning electron microscopic analysis of spikelet hulls of WT and mutant ltbsg1. The outer surface and inner surface were showed up panel (Bars = 50 μm) and bottom panel (Bars = 30 μm), respectively; (E) The cell length of outer and inner surfaces of spikelet hulls in WT and mutant ltbsg1. Values represent the means ± SD (n = 10). ** p < 0.01.

