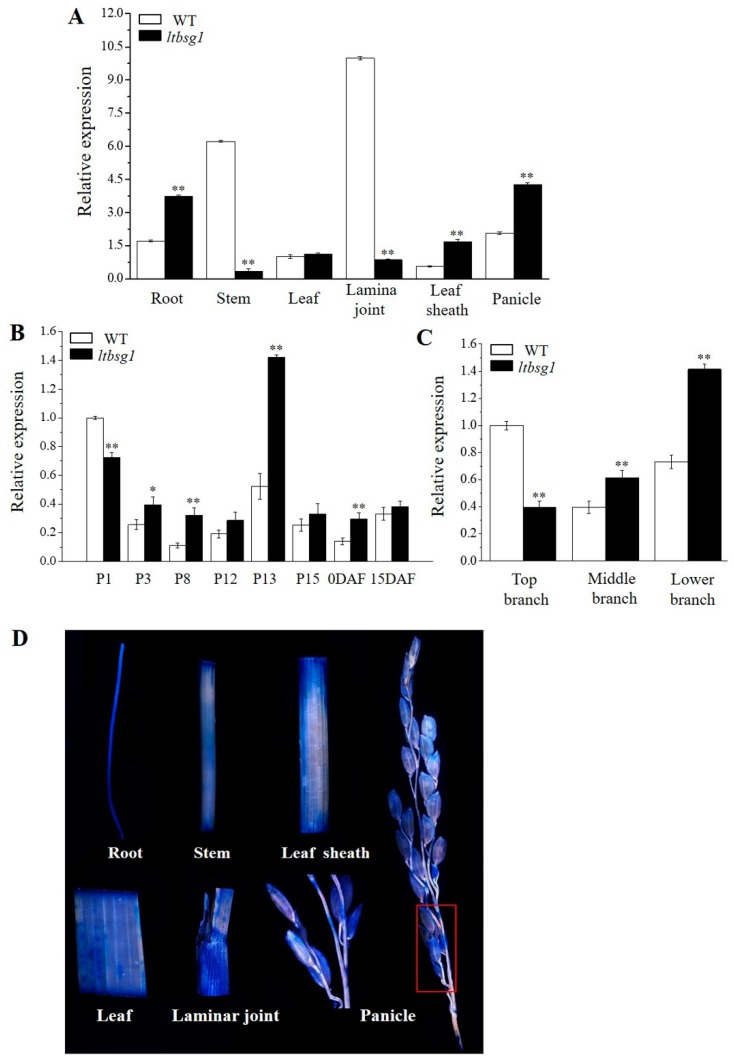
Figure 6.
Expression pattern analysis of LTBSG1. (A) Temporal and spatial patterns of LTBSG1 gene in WT and mutant ltbsg1 at heading stage; (B) LTBSG1 gene expression in panicles of 1 cm (P1) to 15 cm (P15), flowering day (0DAF) and 15 days after fertilization (15DAF); (C) The expression of LTBSG1 in different branches of young panicle in WT and mutant ltbsg1; (D) β-glucuronidase (GUS) assay staining analysis of the LTBSG1 promoter in different tissues. The red box in panicle was magnified. The rice OsActin gene was used as an internal control. Values represent the means ± SD of three biological replicates (n = 3). * p < 0.05; ** p < 0.01.

