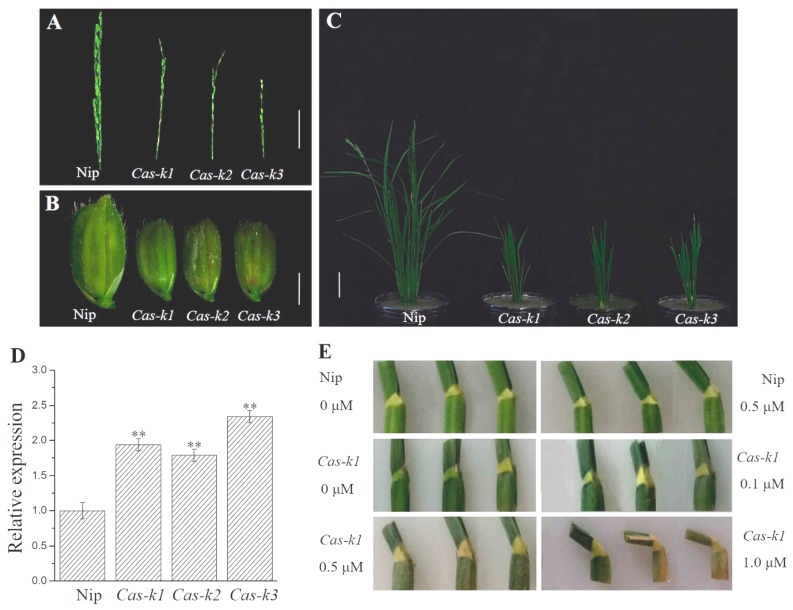
Figure 9.
Phenotype analysis of three knock-out lines Cas-k1, Cas-k2 and Cas-k3. (A) The morphological analysis of panicles of knock-out lines. Bar = 5 cm; (B) The morphological analysis of spikelets in knock-out lines. Bar = 2 mm; (C) Plant phenotype of knock-out lines. Bar = 10 cm; (D) The expression levels of LTBSG1 in the young panicles of knock-out lines; (E) Sensitivity test of lamina joints to 24-EBL in knock-out line cas-k1. Values represent the means ± SD of three biological replicates (n = 3). ** p < 0.01.

