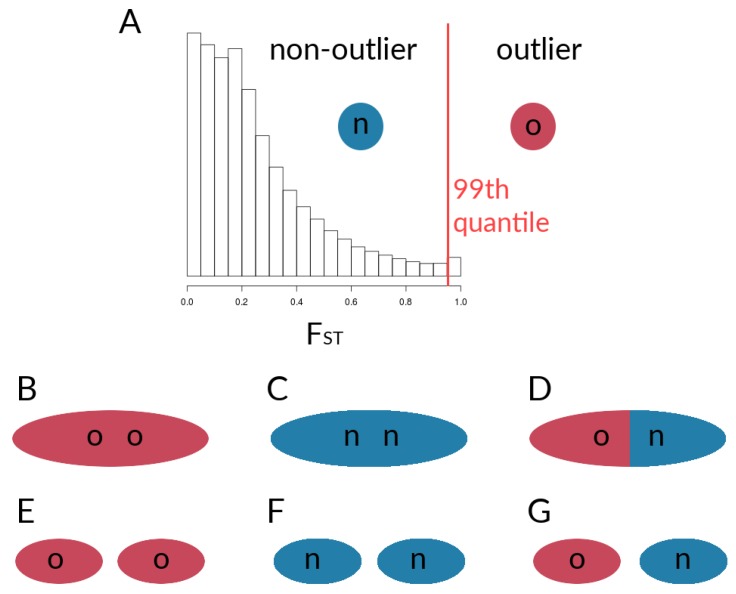
Figure 3.
Schematic of comparisons for the calculation of correlation coefficients between sets of loci within species. (A) Designation of outlier loci based on , which was used for the calculation of for (B) outlier loci within the given chromosome, (C) non-outlier loci within the given chromosome, and (D) outlier loci with non-outlier loci within the given chromosome. Further, values werecalculated for sets of loci on the given chromosome with respective sets sampled from all other chromosomes, with (E) outlier loci vs. outliers from other chromosomes, (F) non-outlier loci vs. non-outliers from other chromosomes, and (G) outlier loci vs. non-outliers from other chromosomes.

