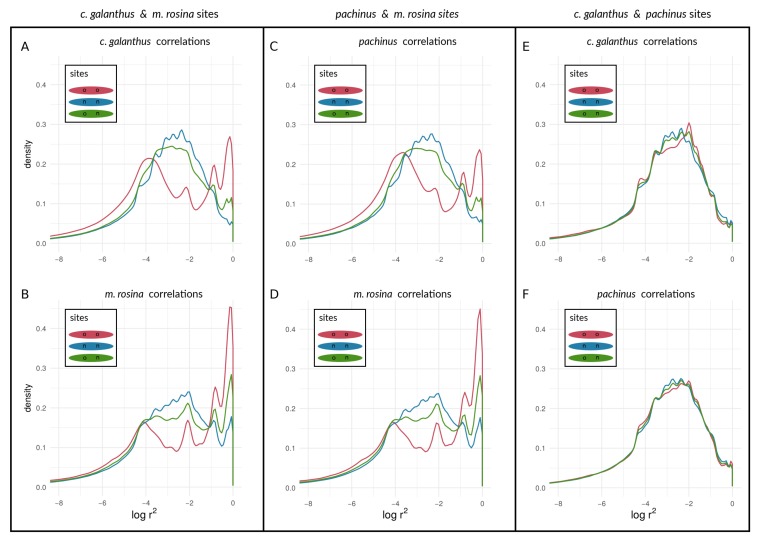
Figure 8.
Density curves of within-species LD for loci at different types of sites on Chromosome 21, determined by outliers. values are shown between outlier loci, between non-outliers, and between outliers and non-outliers for species pairs of H. cydno galanthus and H. melpomene rosina (A,B), of H. pachinus and H. melpomene rosina (C,D), and of H. cydno galanthus and H. pachinus (E,F).

