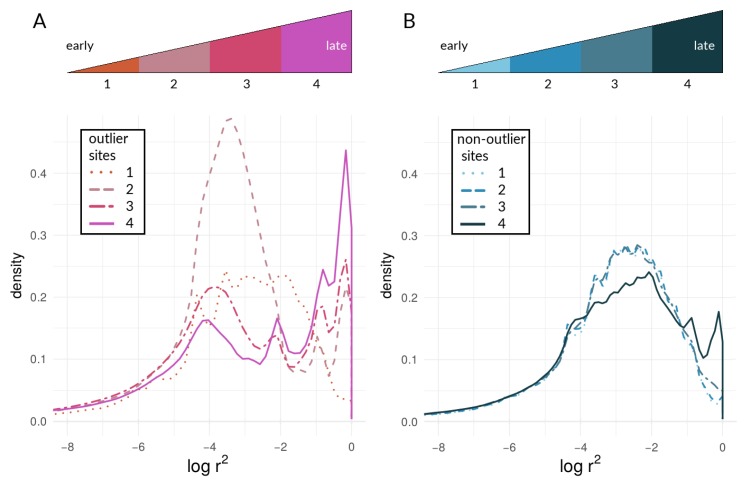
Figure 9.
Density curves of within-species LD for (A) outliers and (B) non-outlier loci. Individual lines correspond to values of (1) pachinus locus pairs for the comparison of c. galanthus and pachinus on Chromosome 2, (2) m. rosina locus pairs for the comparison of pachinus and m. rosina on Chromosome 2, (3) m. rosina locus pairs for the comparison of c. galanthus and m. rosina on Chromosome 21, and (4) m. rosina locus pairs for the comparison of c. galanthus and m. rosina on Chromosome 21. The upper panels illustrate the shift towards higher values of LD within species over time during the period of divergence with ongoing gene flow. Once gene flow has ceased (after 4), within-species LD is expected to decrease again. It should be noted that the stages depicted here do not fully correspond to the stages for the within-deme LD of our simulations (Figure 6). While a late stage has been reached in the simulations, and within-deme LD has already decreased, here, this has presumably not happened yet.

