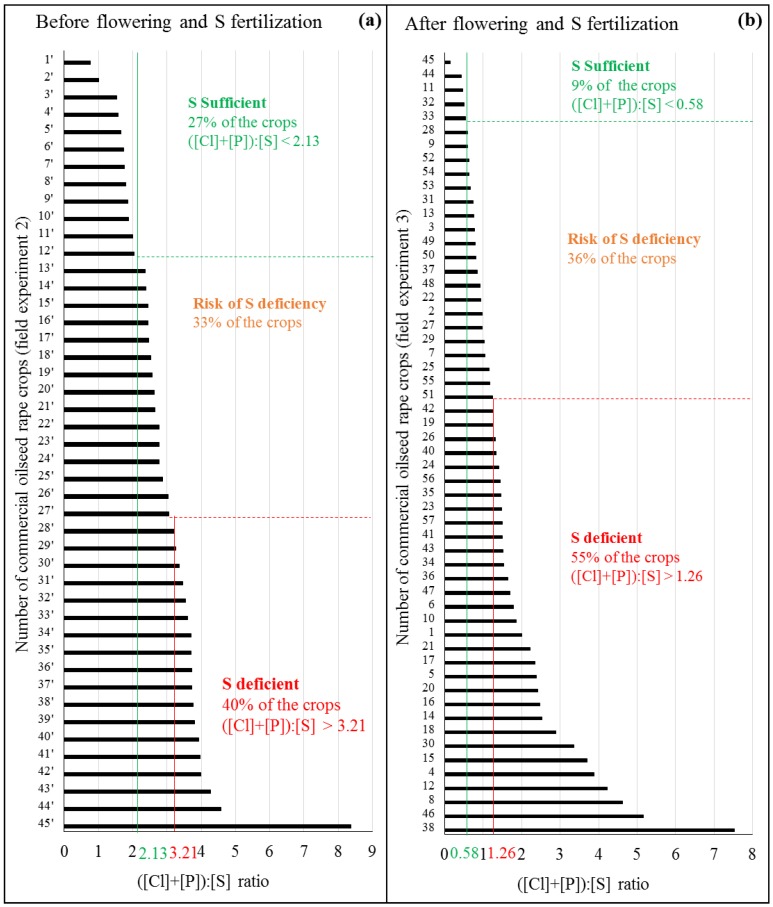
Figure 4.
Commercial oilseed rape varieties (field experiments 2 and 3) classified according to decreasing values of the ([Cl]+[P]):[S] ratio in mature leaves quantified (a) before flowering and S fertilization (Field experiment 2 using 45 commercial varieties from different locations in France, see SD1) or (b) after flowering and S fertilization (Field experiment 3 using 56 commercial varietieslocalized in Calvados, Lower Normandy, France). Threshold values of the ([Cl]+[P]):[S] ratio classified these oilseed rape plots into three S status groups: S deficient, at risk of S deficiency and S sufficient plants.

