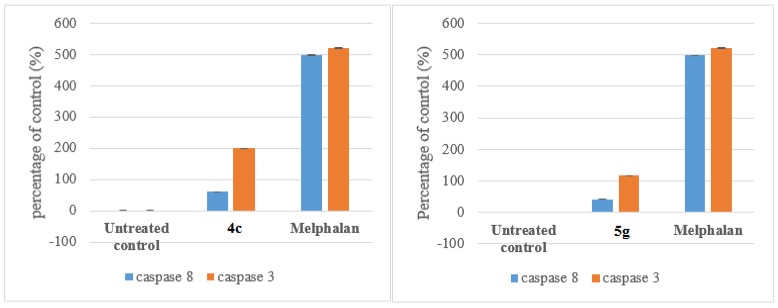
Figure 3.
Caspase 8 and 3 activation as indicated by % changes in the mean integrated fluorescence inensity of the untreated control using A549 cells after 24 h of exposure to 4c and 5g (IC50 values) using Melphalan as a positive control. Bar graph represents the average of one individual experiment performed in quadruplicate. The standard deviations are represented as error bars.

