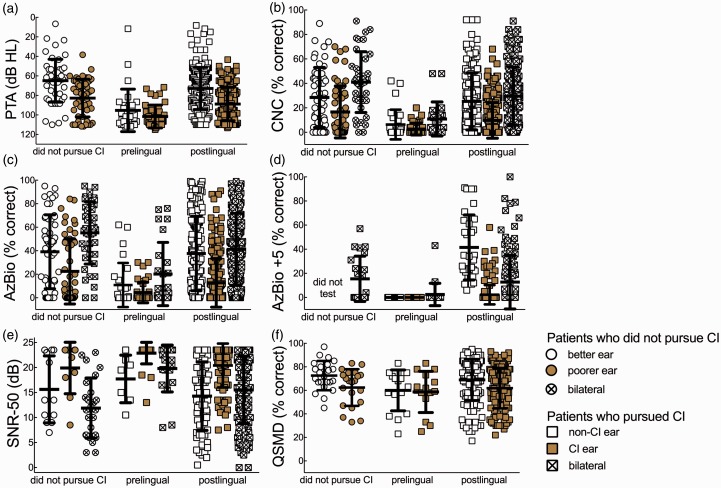
Figure 1.
(a) Individual and mean pure-tone averages (PTA), the average of thresholds at 500, 1000, and 2000 Hz, for patients who did not get an implant in either ear (76.1 dB HL), implanted ears (90.7 dB HL), and contralateral nonimplanted (75.6 dB HL) ears. (b–f) Individual and mean scores for the CNC, AzBio, AzBio at +5 dB SNR, BKB-SIN, and QSMD, respectively. The data are arranged by implanted and nonimplanted ears as unfilled and shaded symbols and bilateral aided as crosshatched symbols. The data for individuals ultimately not pursuing implantation are displayed separately in each figure as better ear, poorer ear, and bilateral.

