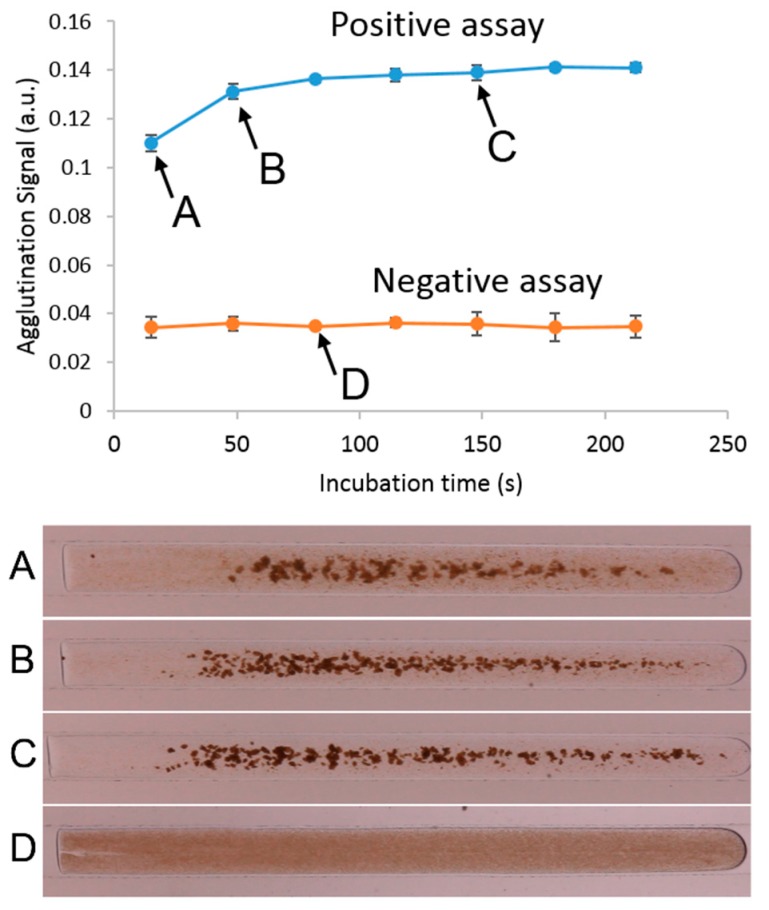
Figure 3.
An example of a typical agglutination assay in this system, as the plug travels through the entire length of the tube. Each measurement was taken at 30-cm increments along the channel, located at the PDMS inspection point. This graph shows the progression of the agglutination, with insets showing the frames captured at each window. Points (A–C) show a positive agglutination test (2.5 µg/mL biotinylated BSA), and point (D) shows a negative test.

