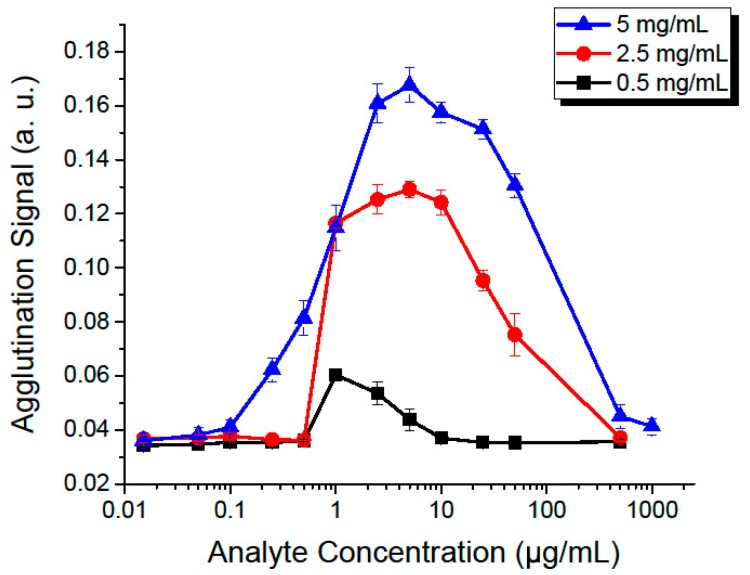
Figure 5.
Effect of increasing the microbead and analyte concentrations, at a fixed flow rate of 175 µL/min, with an incubation time of 150 s. Each point represents repetitions of five experiments, with error bars showing the standard deviation between them. Each curve was made with a different concentration of microbeads, from 0.5–5 mg/mL.

