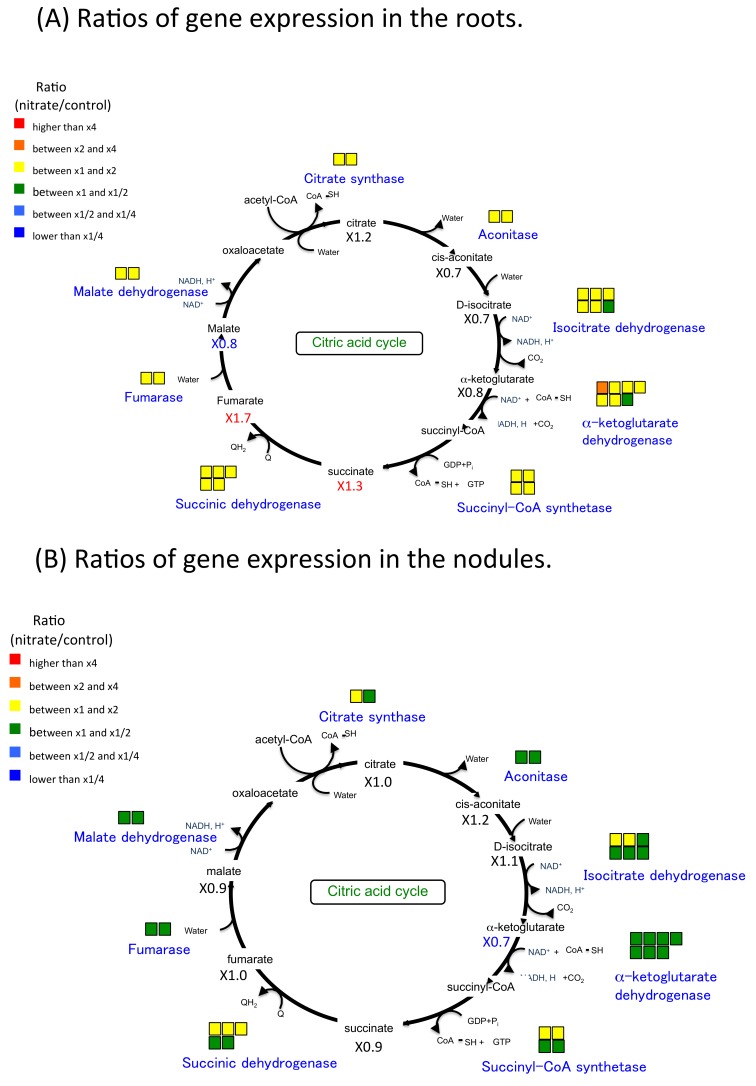
Figure 6.
Ratios of gene expression and metabolite concentrations related to tricarboxylic acid (TCA) cycle in soybean roots and nodules after 24 h of the 5-mM nitrate treatment. (A) Ratios of gene expression and metabolite concentrations in the roots. (B) Ratios of gene expression and metabolite concentration in the nodules. The model shows the metabolic map of glycolysis in the root or nodule cells. The color of squares above enzyme name and the number under the compound abbreviation indicate the same as Figure 3.

