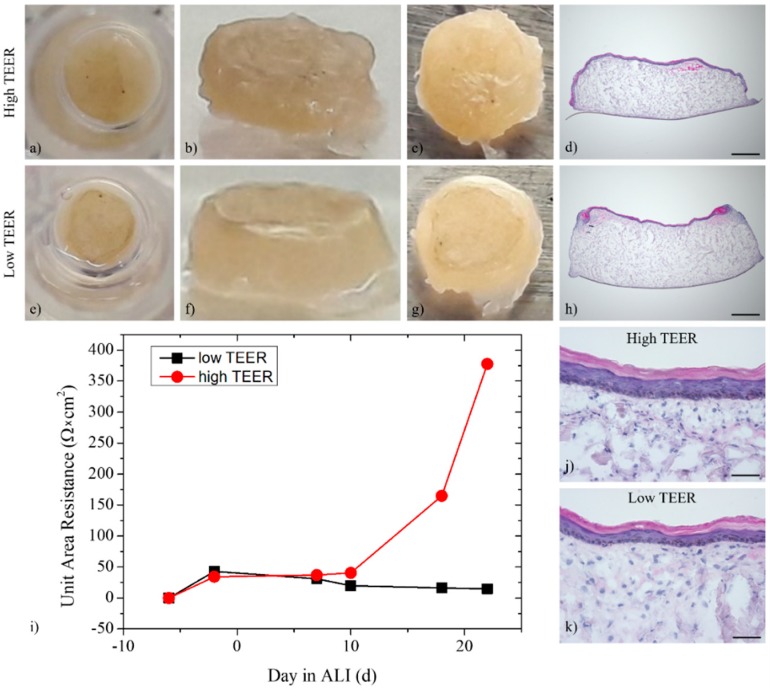
Figure 11.
Macroscopic view and HE staining of the ftSE (a–d,j) with high and (e–h,k) low trans-epithelial electrical resistance (TEER). About 40% of the ftSE showed severe contraction. (i) Performance of the skin barrier was additionally evaluated by TEER. (d,h) Scale bar: 500 µm. (j,k) Scale bar: 50 µm.

