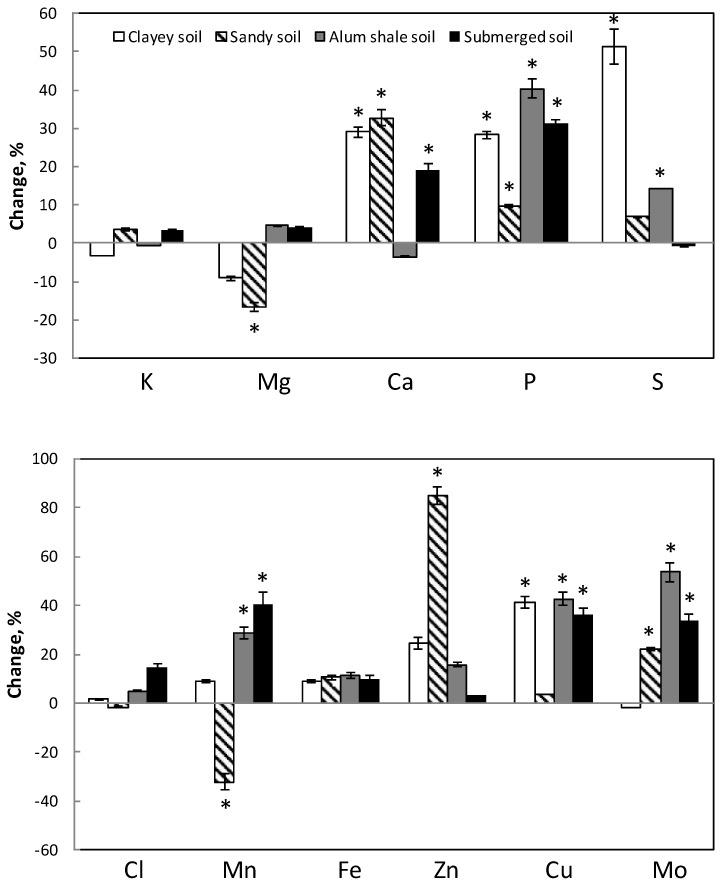
Figure 1.
Changes in available concentration of various macro- and micronutrients in Si-treated soils compared with non Si-treated soils. The four different soils were treated with K2SiO3 corresponding to 1000 kg Si ha−1 for 90 days. n = 5, ± SE. * indicates significant difference between treated and non-treated soil.

