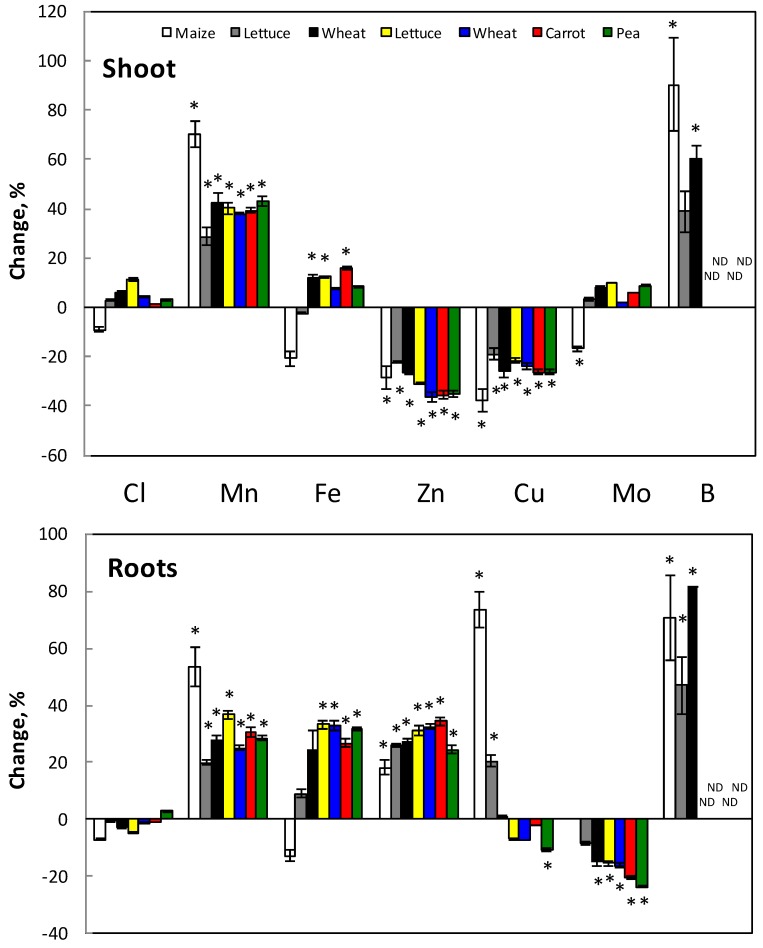
Figure 3.
Changes in the concentration of various micronutrients in roots and shoots of Si-treated plants compared with concentrations in non-treated plants. Bars in white, grey and black show lettuce, wheat and maize treated with K2SiO3 corresponding to 1 mM Si for five days (wheat and lettuce) and 5 mM Si for seven days (maize). n = 5 (maize and lettuce) and 10 (wheat) ± SE. Bars in color show wheat, carrot, lettuce and pea treated with K2SiO3 corresponding to 1 mM Si for three weeks. n = 4, ± SE. * indicates significant difference from the control.

