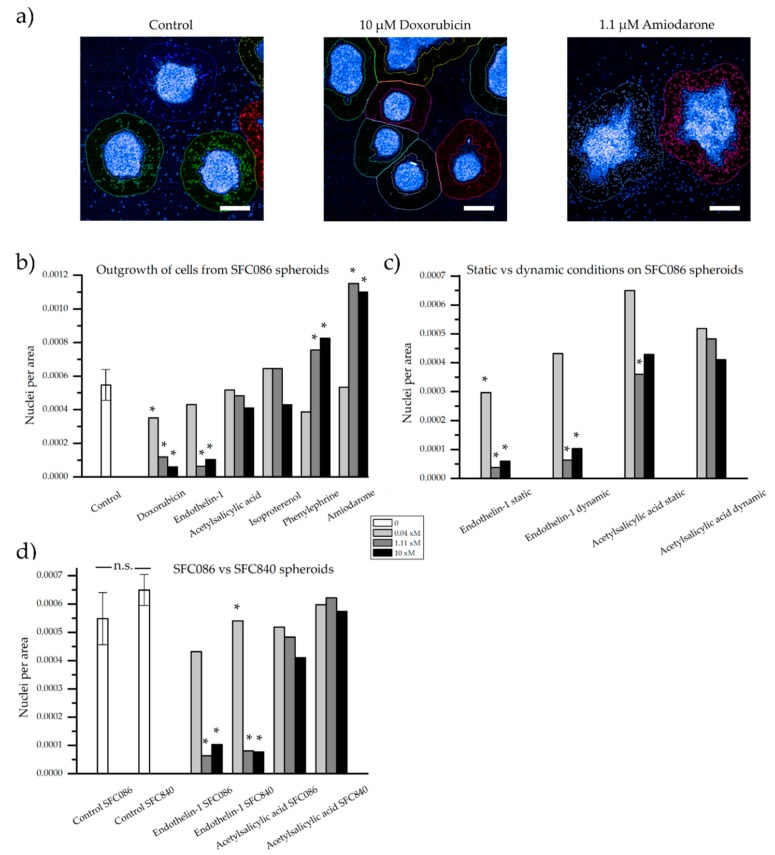
Figure 6.
Quantification of the number of nuclei visible outside a defined area of the spheroids. (a) Examples of the applied contours around spheroids stained with Hoechst 33342 and captured by high content imaging. Number of nuclei per area of analysis from (b) the SFC086 cell line under dynamic conditions exposed to six compounds at three concentrations, (c) the SFC086 cell line at static and dynamic conditions exposed to two compounds, and (d) the SFC086 cell line compared to the SFC840 cell line when exposed to two compounds. Control samples are presented as mean ± standard deviation of three experiments, * denotes a significant difference of the sample from the dynamic control. No significance (n.s.) was observed between the two control samples (SFC086 and SFC840). For endothelin-1, x = n (nM). For all other compounds, x = µ (µM). Scalebar represents 200 µm.

