Figure 3.
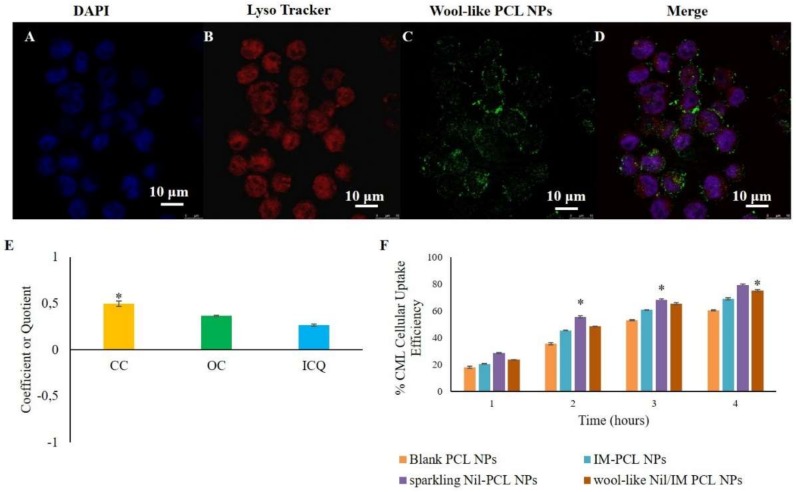
Confocal laser scanning microscopy (CLSM) images of cellular uptake and intracellular localization of wool-like DiO PCL NPs ((C), green) in KU812 leukemic cells after 1 h of incubation. Cell nuclei were counterstained with DAPI ((A), blue). Lysosomal compartment was marked with Lyso-tracker ((B), lysosome marker, red). The merged image (D) shows the co-localization of wool-like DiO PCL NPs (C) with Lyso-tracker (B). Pictures were imaged with a 63X oil immersion objective. Scale bars: 10 µm. (E) Quantitative co-localization analysis between wool-like DiO PCL NPs and LysoTracker for KU812 leukemic cells. For the same confocal images, the CC (coefficient of correlation), OC (overlap coefficient) and ICQ (intensity correlation quotient) were calculated and plotted. Ten different fields were randomly selected for each sample and three distinct experiments were performed; * indicates P-values of <0.05 for t-Student test. (F) Time-dependent cellular uptake efficiency of blank PCL NPs, IM PCL NPs, sparkling Nil loaded PCL NPs and wool-like hollow Nil/IM loaded PCL NPs by KU812 cells. Representative measurements of three independent experiments have been reported and * indicates P-values < 0.05 for Student’s t-test between different time points.

