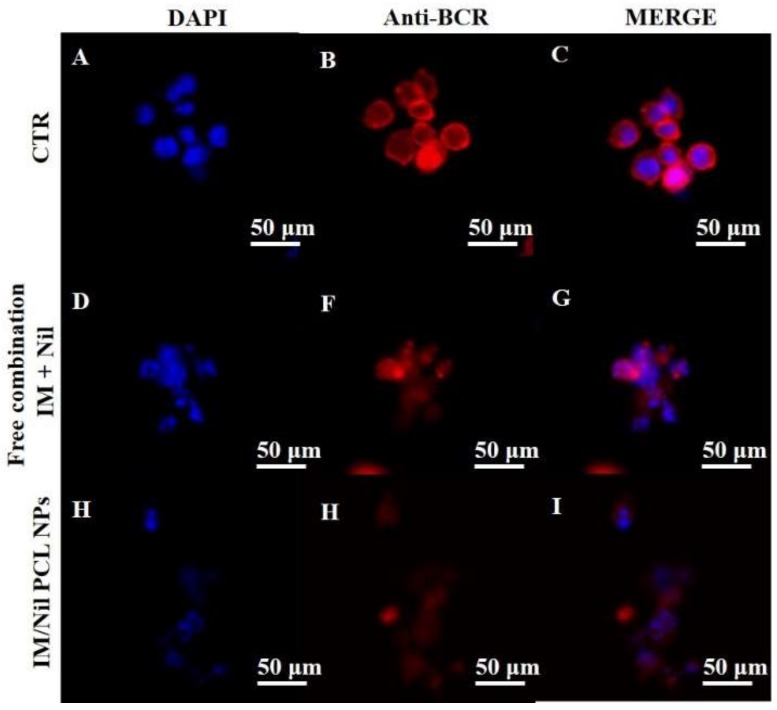
Figure 6.
CLSM images of oncoprotein BCR-ABL cellular pattern distribution (B, F, H, red) in KU812 leukaemia cells after treatment for 24 h with free combination of IM (130 nM) and Nil (28 nM), wool-like Nil/IM PCL NPs (Nil 15 nM, IM 50 nM). Cell nuclei were counterstained with DAPI ((A, D, H), blue). C, G, I show merge images. Representative images of three independent experiments have been reported. 40X oil immersion objective. Scale bars: 50 µm.

