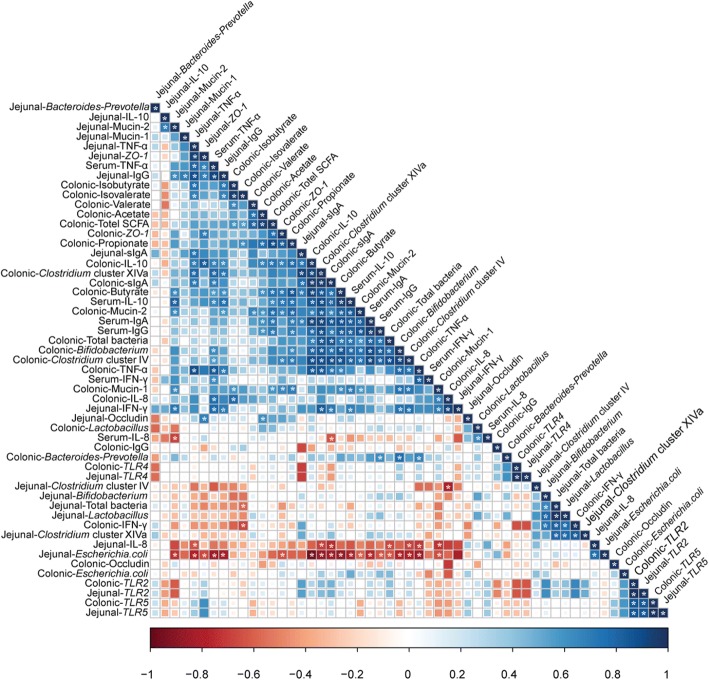
Fig. 5.
Correlation analysis of immune markers levels in the jejunal and colonic mucosa and serum, dominant microbial communities counts in the jejunum and colon and SCFA concentration in the colon. The R package of “corroplot” was used for generating the heat maps. The blue represents a significant positive correlation, and the red represents a significant negative correlation. Asterisks indicate statistically significant difference from control: *P < 0.05. Total SCFA = total short-chain fatty acid; TLR2 = toll-like receptor 2; TLR4 = toll-like receptor 4; TLR5 = toll-like receptor 5; IL-8 = interleukin-8; IL-10 = interleukin-10; IFN-γ = interferon-γ; TNF-α = tumor necrosis factor-α; ZO-1 = zonula occludens-1; sIgA = secretory immunoglobulin A; IgG = immunoglobulin G

