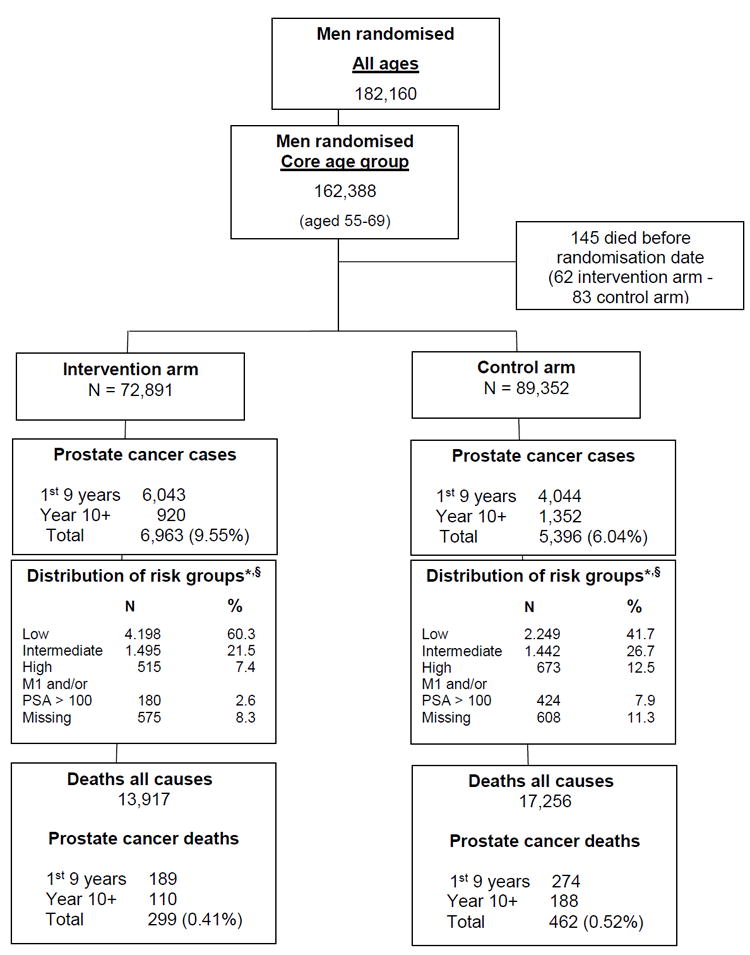
Figure 1. Flow diagram of the ERSPC trial.

* Low risk= T1,T2 with Gleason score (GS) <= 6; Intermediate risk = T1,T2 with GS 7 and T3 with GS <=7; High risk = T1,T2,T3 with GS 8-10 and T4 with any GS; M1 and/or PSA > 100 = any T stage or GS with M1 and/or PSA > 100.
§ More detailed data on prognostic factors are provided in tables 5A, 5B and 5C of the supplementary appendix
