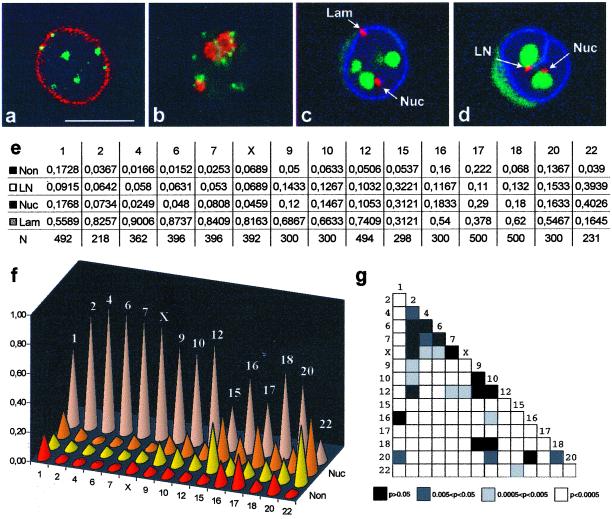
Figure 1.
The intranuclear distribution of centromeric α-satellite DNA is chromosome specific. (a-d) JVM-2 cells were synchronized in G0/G1. Panels a and b depict single optical sections from cells double-labeled with a human autoimmune serum against centromeric proteins (green staining) and either a rabbit serum against lamin B (a, red staining) or a mouse mAb (72B9; Reimer et al., 1987) against the nucleolar protein fibrillarin (b, red staining). Panels c and d depict single optical sections from cells triple-labeled with a digoxigenin-coupled α-satellite probe for chromosome 1 (red staining), biotin-coupled probe for 28S rRNA (green staining), and rabbit antilamin B antibodies (blue staining). The α-satellite signals juxtaposed or superimposed on the lamina but not on nucleoli are classified in category Lam (c), whereas signals adjacent to a nucleolus but not to the lamina are classified as Nuc (c, d). The category LN (d) includes signals simultaneously adjacent to both lamina and nucleolus, and Non refers to signals that are nonadjacent to either lamina or nucleoli. Note that α-satellite DNA may be adjacent to the lamina even when it lies in the interior of the nucleus, due to invaginations of the nuclear envelope (d). Bar, 10 μm. Panel e shows the frequencies of α-satellite signals in each category; N is the number of signals analyzed. Panel f depicts graphically the distribution of α-satellite signals by the four categories. Panel g shows a chart measuring the similarity of α-satellite distribution for each pair of chromosomes. Each chart entry (small box) corresponds to the p-value of the chi-square test between the chromosome in that row and the chromosome in that column. Small p values, corresponding to statistically significant differences, are represented in light colors, and large p values, corresponding to similar centromere distributions, are represented in dark colors.

