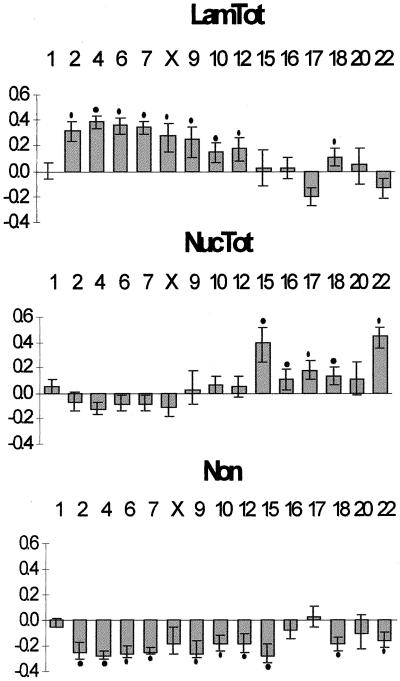
Figure 2.
The distribution of centromeric α-satellite DNA in the nucleus is not random. Differences between the observed frequencies of α-satellite DNA distribution in the nucleus and the expected frequencies, according to a model of random uniform chromatin distribution. The categories Lam and LN were joined to produce LamTot, and categories Nuc and LN were merged into NucTot. In short, category LamTot corresponds to the totality of α-satellite signals in the lamina region, whereas NucTot represents the totality of α-satellite signals in the nucleolar region. The mean expected frequencies, according to a model of random uniform distribution, are LamTot, 52%; NucTot, 22%; and Non, 32% (see MATERIALS AND METHODS for details). Each bar in the graph represents the deviation of the observed from the expected frequencies. A positive bar means that the α-satellite signals are more frequently localized in that compartment than expected, whereas a negative bar means that the α-satellite signals are less frequent in that compartment than expected. The error bars represent the 95% confidence intervals (binomial distribution). A black dot indicates a significant difference between the observed and expected frequencies (one-sided binomial test, p < 0.05, with Bonferroni correction for multiple comparisons).

