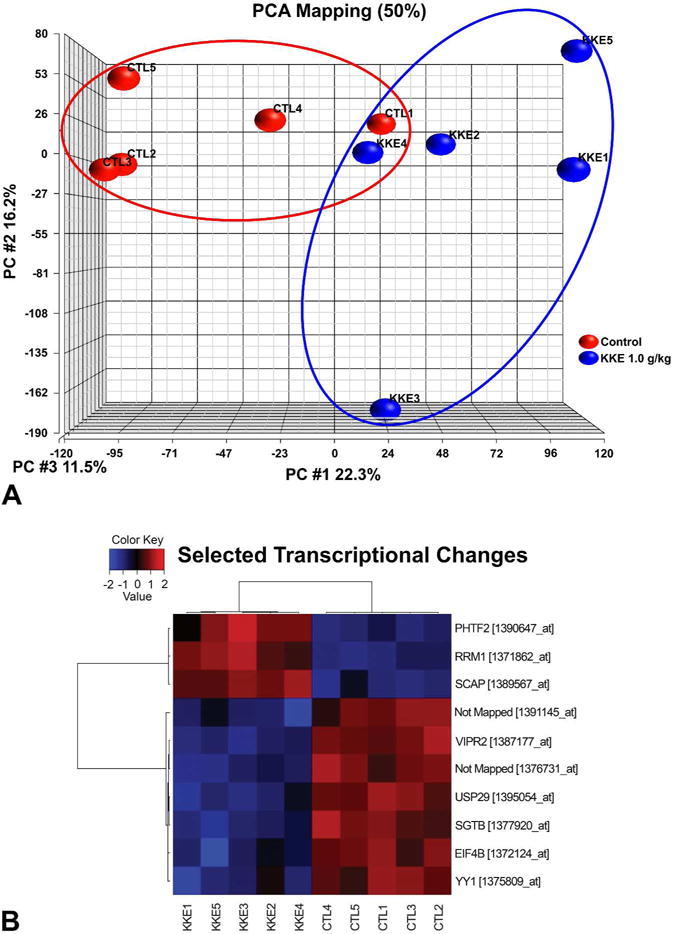
Figure 4.

Gene expression analysis. (A) Principal component analysis (PCA) of global gene expression profiles on the retinas from control (red) and KKE 1.0 g/kg (blue) samples demonstrated a nearly distinct clustering. (B) Heat map of differentially expressed 10 transcripts between KKE 1.0 g/kg and control groups using a false discovery rate of 5%. Red, high expression; blue, low expression; KKE, kava kava extract; CTL, control
