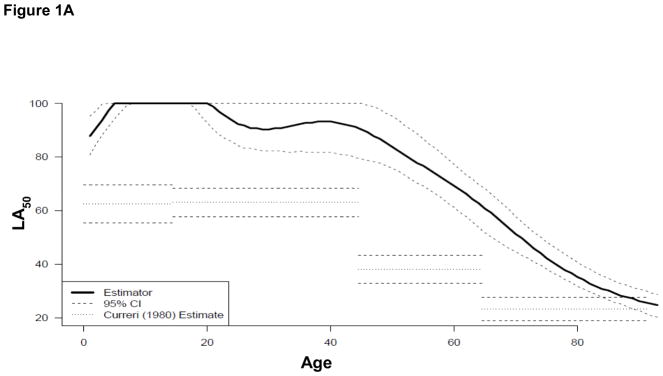
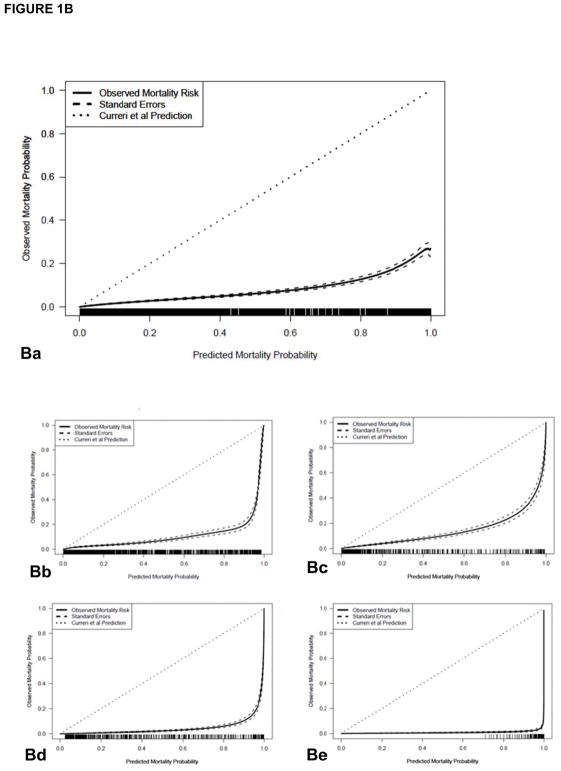
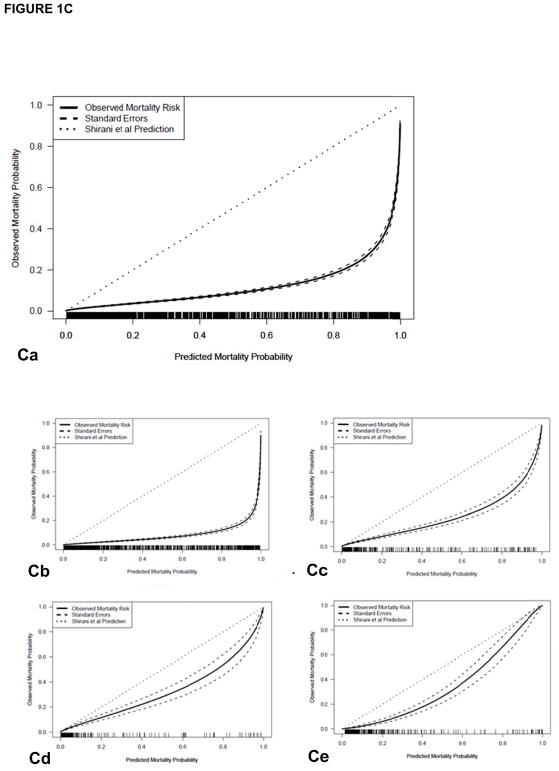
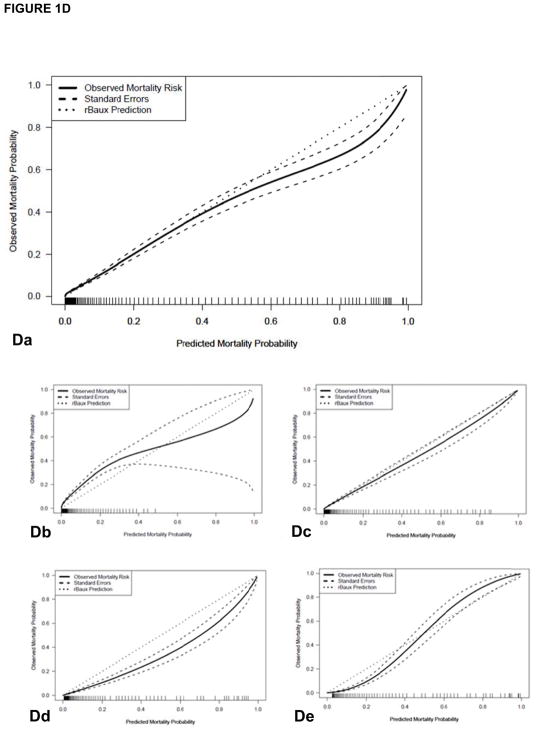
Figure 1.
(A) The LA50 function of the nonlinear prediction model (solid line) with 95% confidence intervals (CI, dashed lines) compared to Curerri’s model (dotted lines). (B–D) shows a comparison of (B) Curreri, (C) Shirani, and (D) revised Baux prediction of probability of mortality (small dotted line at 45°) versus observed rate of mortality (solid line) along with standard errors, overall and divided by age groups. (Ba) The Curreri predicted and true survival rates overall and among different age groups: (Bb) 0 to 14 years, (Bc) 15 to 44 years, (Bd) 45 to 64 years, (Be) >65 years, from 1989 to 2017. Similar comparisons are illustrated with (Ca-e) Shirani and (Da-e) the revised Baux analysis. In both historical cases, the predicted fit falls below the line of agreement, indicating that these models predicted a greater number of mortalities than we observed in our dataset.


