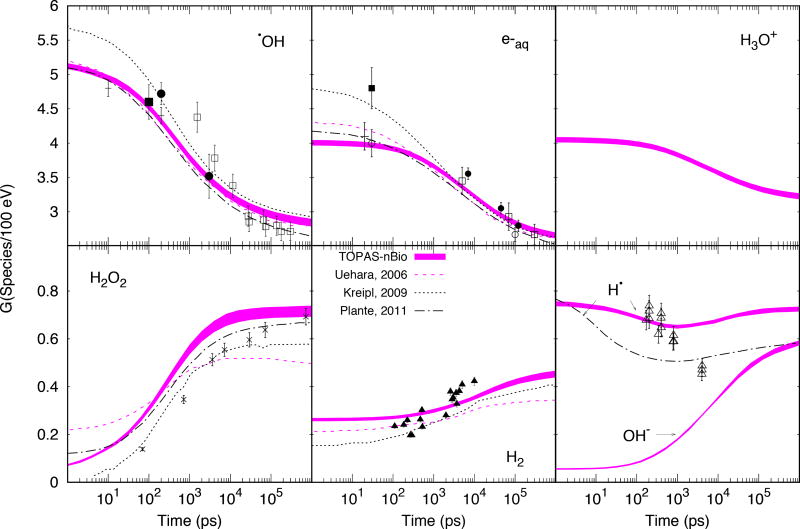
Figure 4.
Time evolution of G-values for mono-energetic electrons of 1 MeV. TOPAS-nBio results as thick colored lines, with the thickness of the lines representing 1 standard deviation of the mean. Calculated data from other MC codes are shown with dashed (Uehara and Nikjoo 2006), dotted (Kreipl, Friedland, and Paretzke 2009) and dot-dashed (Plante 2011a) lines. Experimental data are plotted as points. For •OH: □ 60Co γ-rays (Laverne 2000), ■ ~2 MeV electrons (Jay-Gerin and Ferradini 2000), ● 20–22 MeV electrons (Jonah and Miller 1977), the latter with data scaled by a factor of 0.8 (see (Kreipl, Friedland, and Paretzke 2009)), + 7 MeV electrons (El Omar et al. 2011). For e−aq: □ ~35 MeV electrons (Shiraishi et al. 1988), ■ ~45 MeV electrons (Sumiyoshi and Katayama 1982), ○ ~40 MeV electrons (Wolff et al. 1973; Hunt et al. 1973), ● ~2.9 MeV electrons (Buxton 1972), + 20 MeV electrons (Muroya et al. 2005). For H2O2: × 60Co γ-rays (Laverne 2000). For H2: ∆ 60Co γ-rays (Draganić and Draganić 1975). For H•: ∆60Co γ-rays (Z. D. Draganic and Draganic 1972).

