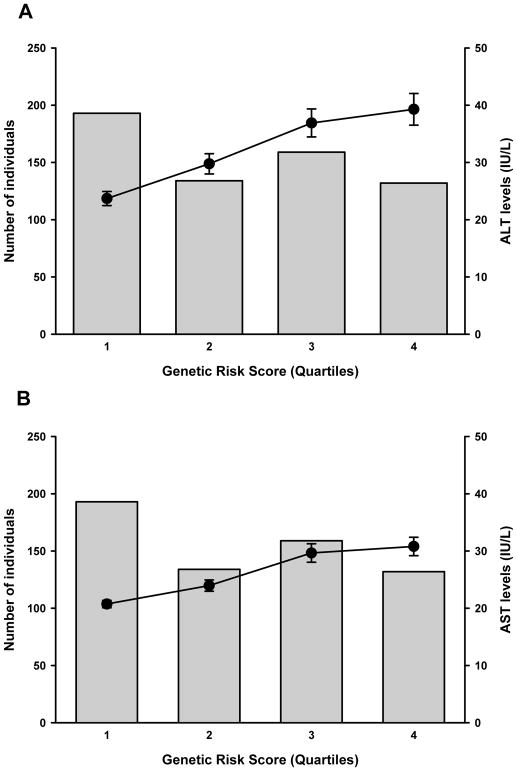
Fig. 1.
Distribution of the weighted genetic risk score and cumulative effects of the risk alleles from six SNPs on ALT and AST serum levels. Mean ALT (A) and AST (B) levels significantly increase as a function of the number of risk alleles (quartiles) (P=1.0×10⁻⁹ and 7.7×10⁻¹¹), respectively, adjusted for age, sex, BMI, and admixture.

