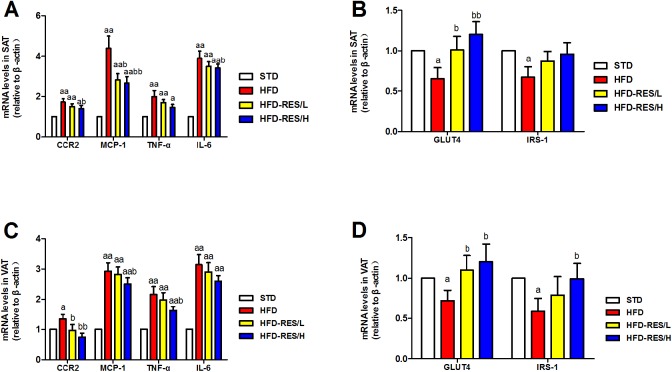
Figure 6. Effects of resveratrol treatment on the target mRNA expression in SAT and VAT.
(A) The mRNA levels of inflammatory cytokines (CCR2, MCP-1, TNF-α and IL-6); (B) the mRNA levels of GLUT4 and IRS-1 in SAT; (C) the mRNA levels of inflammatory cytokines (CCR2, MCP-1, TNF-α and IL-6) in VAT; (D) the mRNA levels of GLUT4 and IRS-1 in VAT. a, P < 0.05 and aa, P < 0.01 vs. the STD group; b, P < 0.05 and bb, P < 0.01 vs. the HFD group. The data are represented as the mean ± SD.

