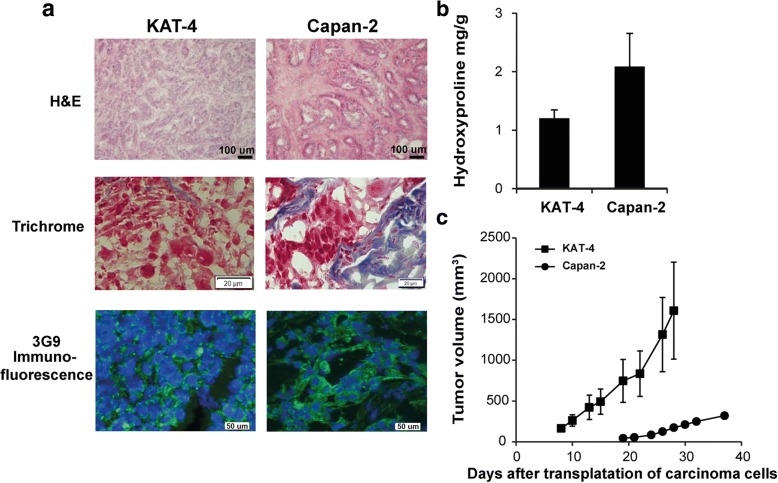
Fig. 3.
Comparison of untreated KAT-4 and Capan-2 carcinoma models. a Hematoxylin and Eosin and Sirius red staining in KAT-4 and Capan-2 carcinomas (bars = 100 μm). Trichrome staining (bars = 20 μm) and immunofluorescence staining with biotinylated 3G9 antibody (green) shows that the expression of integrin αVβ6 is located at the cell membrane in both KAT-4 and Capan-2 carcinomas (cell nuclei stained with DAPI, blue; bars = 50 μm). b Collagen content in untreated KAT-4 (n = 4) and Capan-2 (n = 5) carcinomas, represented by hydroxyproline mg/g wet weight. c Average growth of untreated KAT-4 (n = 8) and Capan-2 tumors (n = 7), represented in mm3 measured externally (length x width x height)

