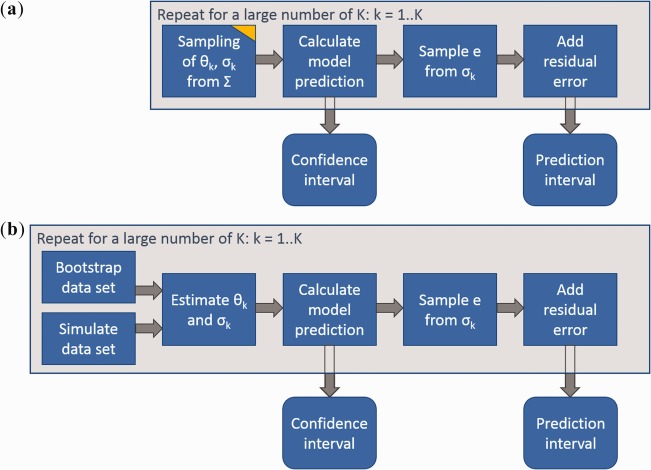
Figure 1.

Calculation of confidence and prediction intervals for regression models. (a) Simulation approach. (b) Repeated estimation/simulation. The yellow edge indicates sampling from uncertainty in contrast to sampling from random variability. Confidence and prediction intervals are determined as quantiles of the simulated values (e.g., 5th and 95th percentile). Notation: Θ, model parameters; σ, residual variability; Σ, parameter covariance matrix; e, residual error; K, number of sampled parameter sets.
