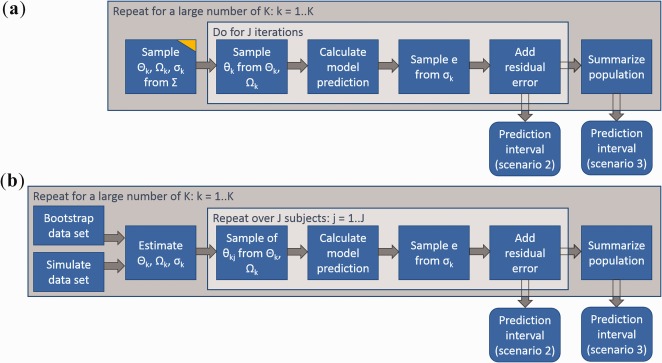
Figure 2.

Calculation of prediction intervals for nonlinear mixed effect models. (a) Simulation approach. (b) Repeated estimation/simulation. The yellow edge indicates sampling from uncertainty in contrast to sampling from random variability. Prediction intervals are determined as quantiles of the simulated values (e.g., 5th and 95th percentile). Notation: Θ, population parameters; σ, residual variability; Σ, parameter covariance matrix; Ω, random‐effects covariance matrix; θ, individual parameter set; e, residual error; K, number of sampled parameter sets; J, number of sampled individuals from a population.
