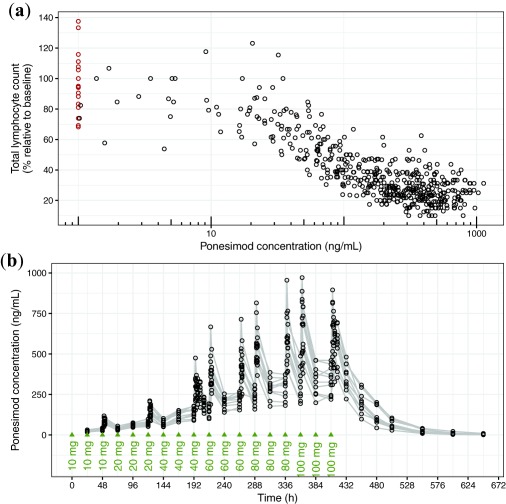
Figure 3.

Case study datasets. (a) Pharmacokinetic/pharmacodynamic dataset. Observed data with concentrations above and below the limit of quantification are indicated as black and red circles. (b) Pharmacokinetic dataset. Observed are indicated as black circles. Gray lines connect data from individuals. Dosing times are indicated with green triangles.
