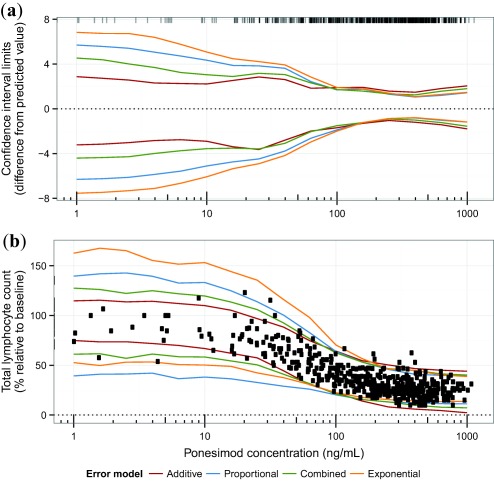
Figure 5.

Comparison of confidence and prediction intervals for different error models. (a) 95% confidence interval width (i.e., the difference of the 2.5th and 97.5th percentile from the predicted value), f (c, ). Concentration values of the data are indicated by ticks at the top of the panel. (b) 95% prediction intervals. Observed data are indicated as circles. 1,000 simulations (simulation approach) and 1,000 parameter re‐estimations (simulation‐estimation approaches) were performed.
