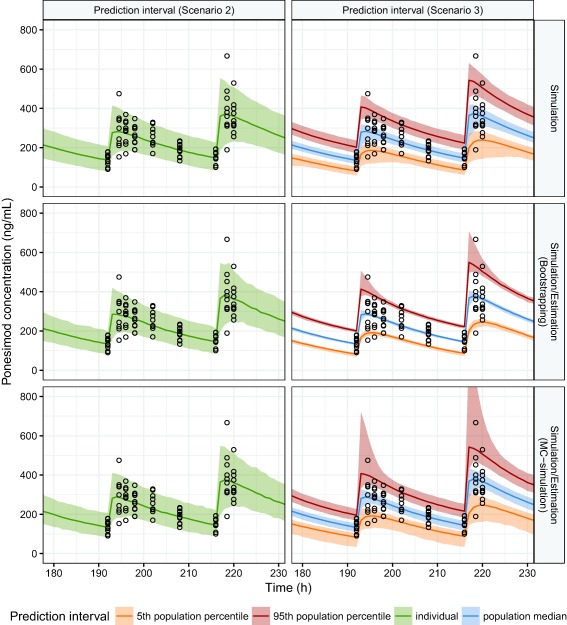
Figure 6.

Confidence and prediction intervals for the nonlinear mixed effect pharmacokinetic model. For the estimation/simulation approaches, parameters were re‐estimated 1,000 times using bootstrapped or simulated datasets. A population of 1,000 subjects was simulated for each set of re‐estimated parameters. For the simulation approach, parameters were sampled 1,000 times from the estimate covariance matrix. A population of 1,000 subjects was simulated for each set of sampled parameters. Observed data are indicated as circles.
