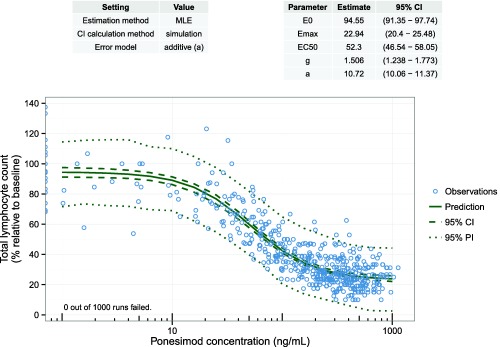
Figure 7.

Result visualization with the R library pecan to calculate confidence intervals and prediction intervals for nonlinear regression models. Settings for parameter estimation and confidence interval calculation are given in the left table. The right table displays the parameter estimation results (i.e., parameter estimates with confidence intervals). Observed data (blue circles) and prediction with confidence interval and prediction interval (solid, dashed, and dotted green line). CI, confidence interval; EC50, half‐maximal effective concentration; Emax, maximum effect; MLE, maximum likelihood estimate; PI, prediction interval.
