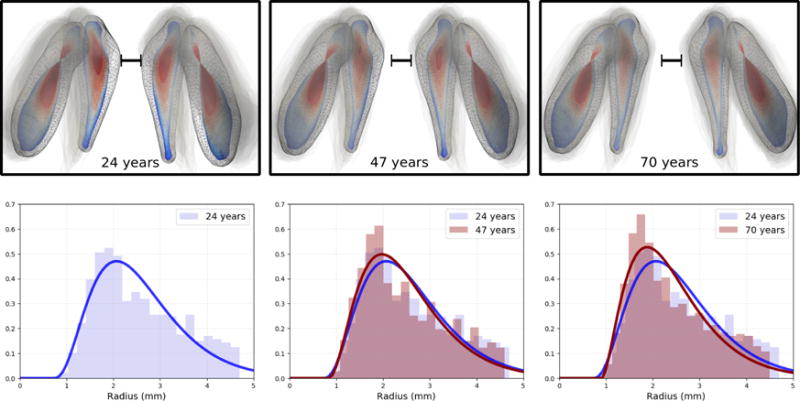
Fig. 3.

Normative model of aging. (Top) CM-Rep surfaces colored with radius scalar fields. Reconstructed shape complexes (mesh) are sampled from the reconstructed shape trajectory at age 24, 47, and 70 from left to right. The oldest 20 observations are overlaid as transparent gray to show the final location of the shape-complex. (Bottom) Normalized radius histograms of each left caudate shape from the top row. We observe that radius distributions tend to have a larger portion of smaller radii (thinning) with increased age. Gamma functions are fitted to show the change of radii distribution with age.
