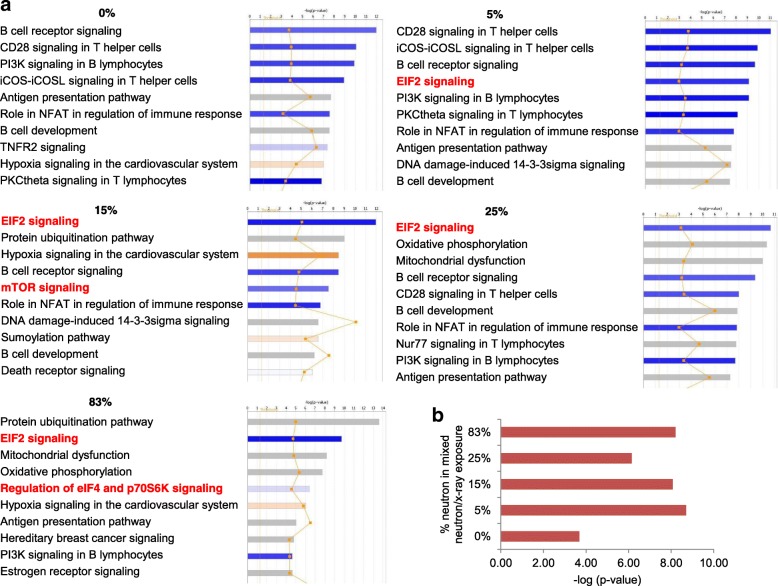
Fig. 2.
a Ingenuity Pathway Analysis (IPA) top 10 canonical pathways for each treatment (p < 0.001). The most statistically significant canonical pathways identified in the neutron exposure are listed according to their p value (−log; orange line). Blue bars: negative z-score; orange bars: positive z-score; gray bars: no activity pattern available. The orange squares represent the ratio of the number of differentially expressed genes found in each pathway over the total number of genes in that pathway. b IPA on EIF2-related differentially expressed genes plotted according their p-value (−log)

