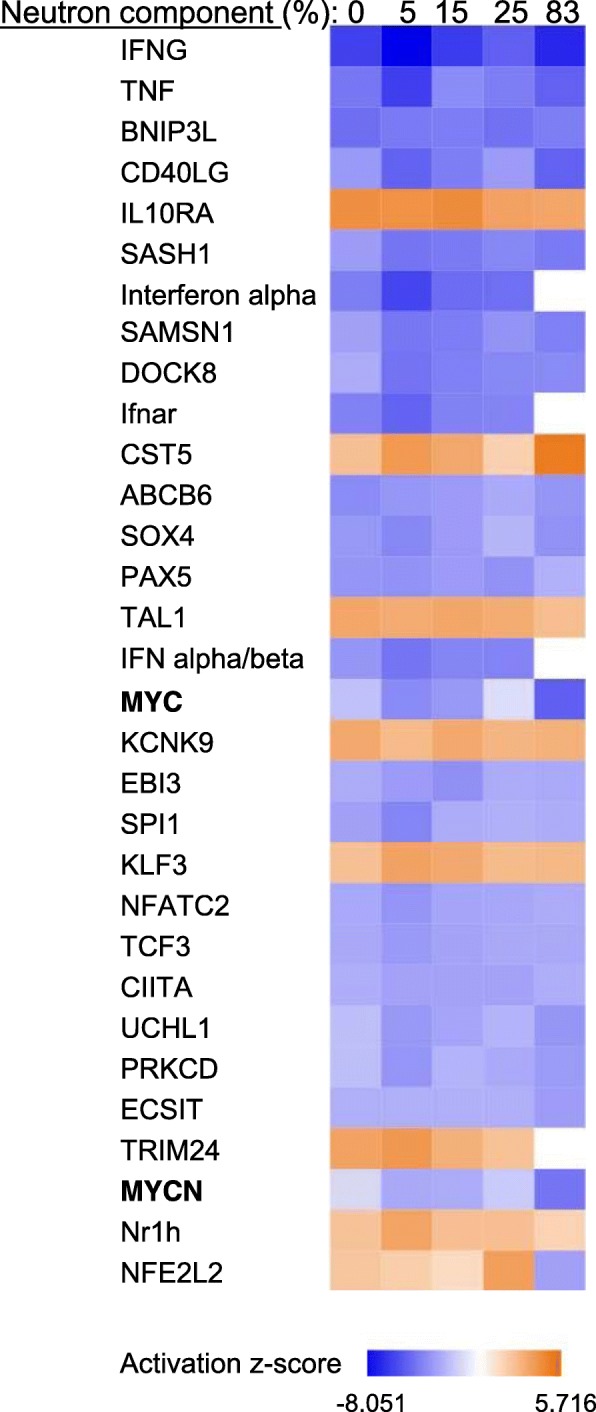
Fig. 4.

Potential upstream regulators of differentially expressed genes by neutron component using Ingenuity pathway upstream regulator. Top predicted upstream regulators (|z| > 2) are shown. Blue color represents negative z-scores; orange color represents positive z-scores as indicated in the color key. c-Myc and Mycn transcription factors are in bold
