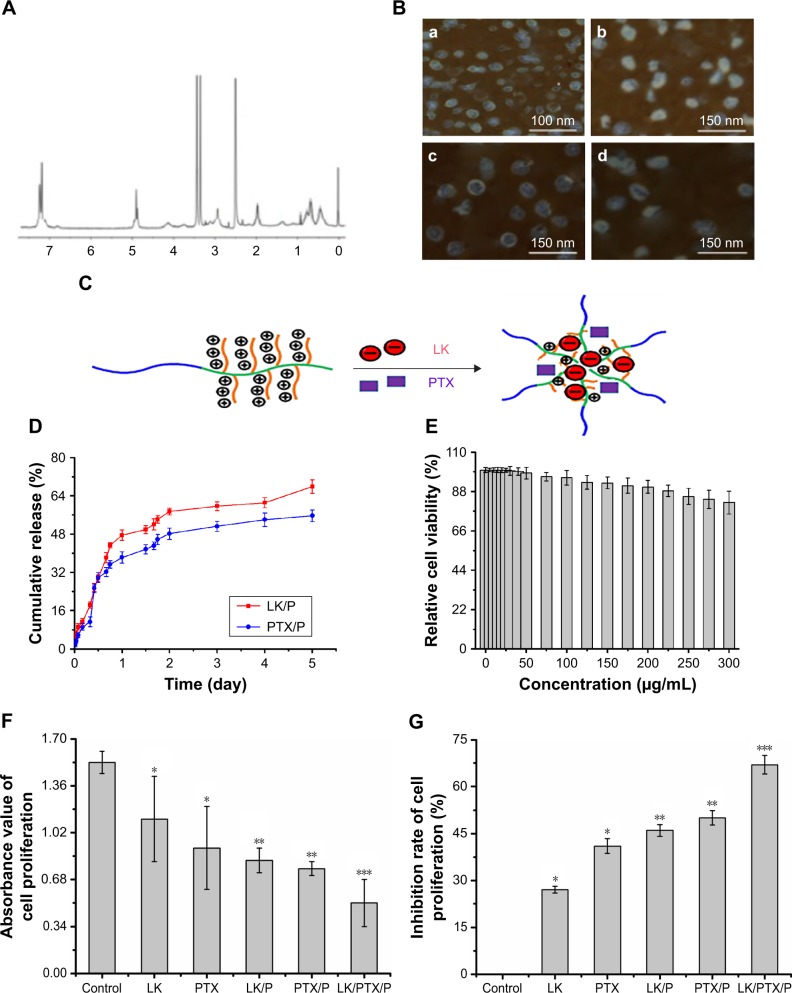
Figure 2.
Characterization of nanocomplexes.
Notes: (A) 1H NMR spectra of PEG-b-(PELG-g-(PZLL-r-PLL)); (B) TEM image of copolymers, (a) PEG-b-(PELG-g-(PZLL-r-PLL)), (b) LK/PEG-b-(PELG-g-(PZLL-r-PLL)), (c) PTX/PEG-b-(PELG-g-(PZLL-r-PLL)), and (d) LK/PTX/PEG-b-(PELG-g-(PZLL-r-PLL)); (C) Loading pattern diagram of PEG-b-(PELG-g-(PZLL-r-PLL)); (D) Cumulative releasing profile of LK and PTX from PEG-b-(PELG-g-(PZLL-r-PLL)) complexes (n=5); (E) Relative cell viability (n=5); (F) Absorbance value of cell proliferation (n=5); (G) Inhibition ratio of cell proliferation (n=5). Data are expressed as the mean ± SD. *p<0.01 vs control, **p<0.05 vs LK or PTX, ***p<0.01 vs LK/P or PTX/P.
Abbreviations: 1H NMR, 1H nuclear magnetic resonance; LK, lumbrokinase; P, PEG-b-(PELG-g-(PZLL-r-PLL)); PEG-b-(PELG-g-(PZLL-r-PLL)), poly(ethylene glycol)-b-(poly(ethylenediamine l-glutamate)-g-poly(ε-benzyoxycarbonyl-l-lysine)-r-poly(l-lysine)); PTX, paclitaxel.

