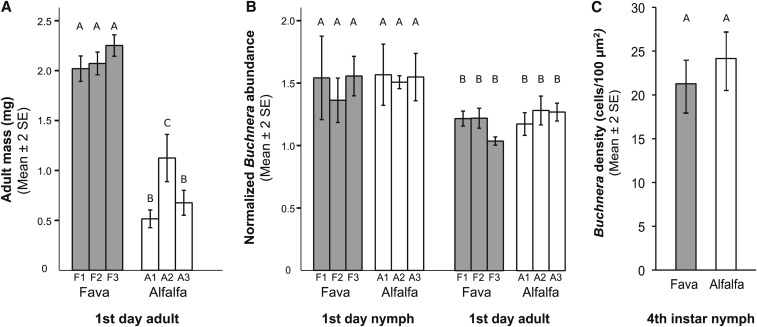
Figure 1.
Effects of a specialized host-plant diet on aphid and Buchnera phenotype. Different letters above bars indicate significant differences between aphid sub-lines within each sub-figure (A, B, C) (Tukey’s multiple comparison post-hoc test P < 0.05) (A) Aphid mass of 1st day adults. N = 20 aphid individuals per aphid sub-line. (B) Buchnera abundance of 1st day nymphs and 1st day adults measured by a single copy Buchnera gene with RT-qPCR and normalized by a single copy aphid gene. N = 6 aphid individuals per aphid sub-line (C) Buchnera cell density of 4th instar nymphs measured by the number of Buchnera cells per unit area (100 µm2) using TEM.

