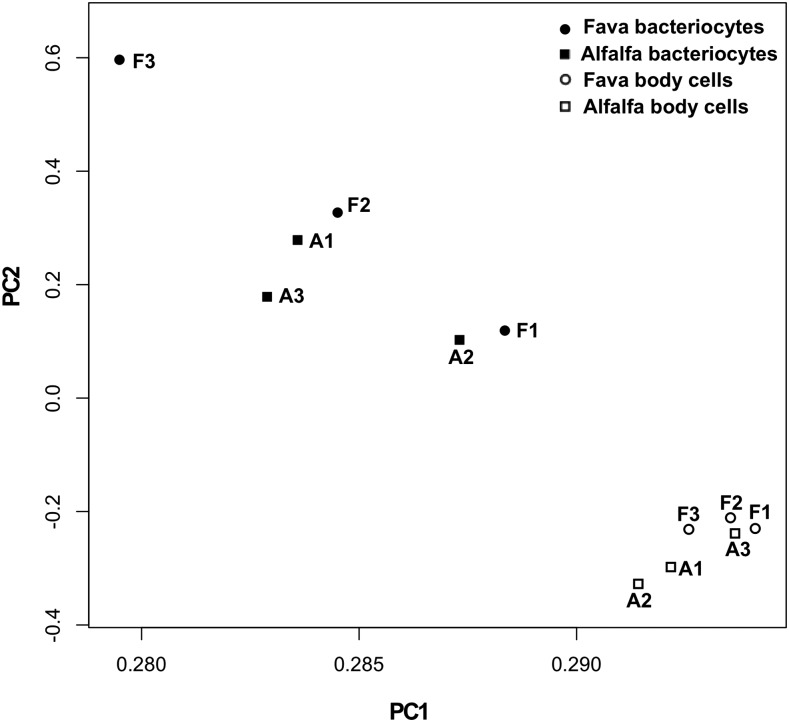
Figure 5.
Principal Component Analysis of CpG methylation profiles for each bacteriocytes and body sample. F1, F2, and F3 denote 3 biological replicates of aphid sub-lines within the fava treatment. A1, A2, A3 denote 3 biological replicates of aphid sub-lines within the alfalfa treatment. PC1 explains 93.1% of total variance with standard deviation of 3.34. PC2 explains 1.5% of total variance with standard deviation of 0.43.

