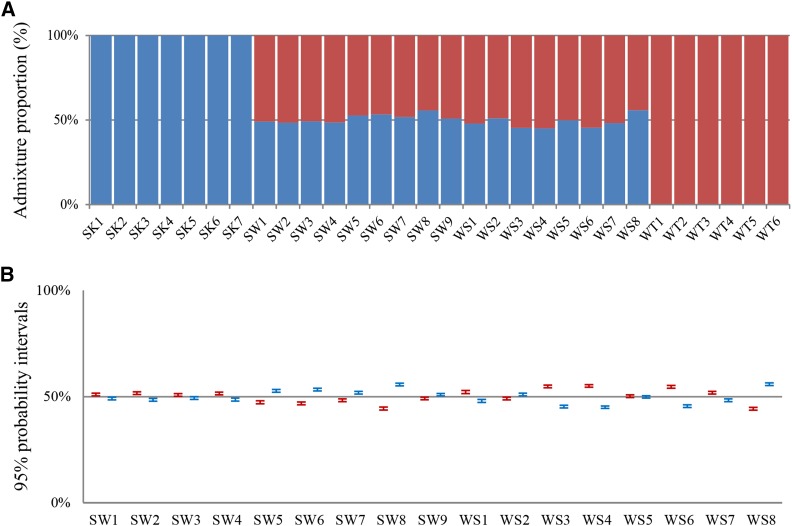
Figure 3.
Estimated admixture proportions and cluster membership. Plot of admixture proportion for all individuals (A) and their 95% credible intervals (CIs) for the F1 hybrids (B) for each individuals for K = 2 (number of assumed populations). A dataset of randomly selected 50,000 SNP markers was used for this analysis.

