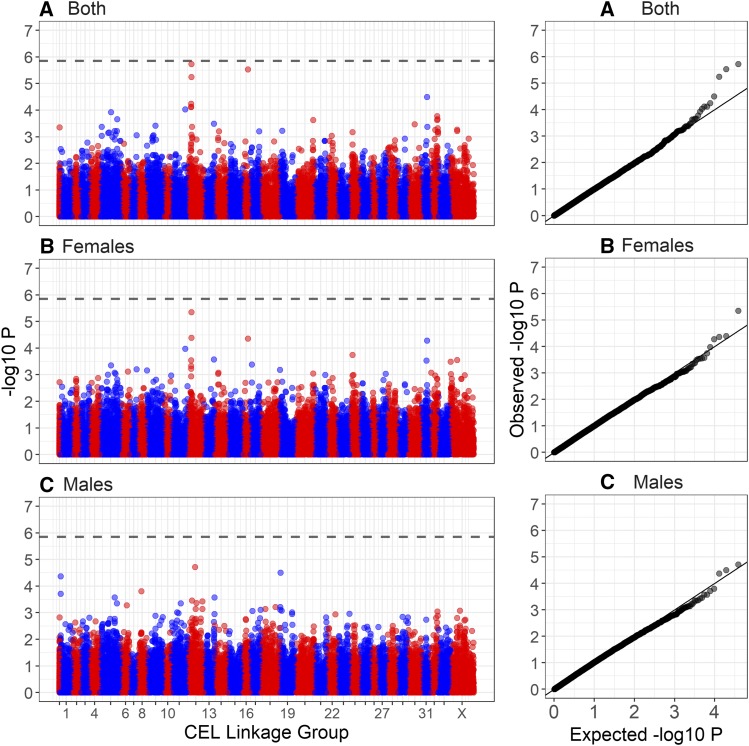
Figure 2.
Manhattan plot of genome-wide association of autosomal crossover count (ACC) for (A) all deer, (B) females only and (C) males only. The dashed line is the genome-wide significance threshold equivalent to P < 0.05. The left-hand plots show association relative to the estimated genomic positions on deer linkage groups from Johnston et al. (2017). Points have been color coded by chromosome. The right-hand plots show the distribution of observed values against those under the null expectation. Association statistics have been corrected for the genomic control inflation factor . Underlying data are provided in Table S3 and sample sizes are given in Table 1.

