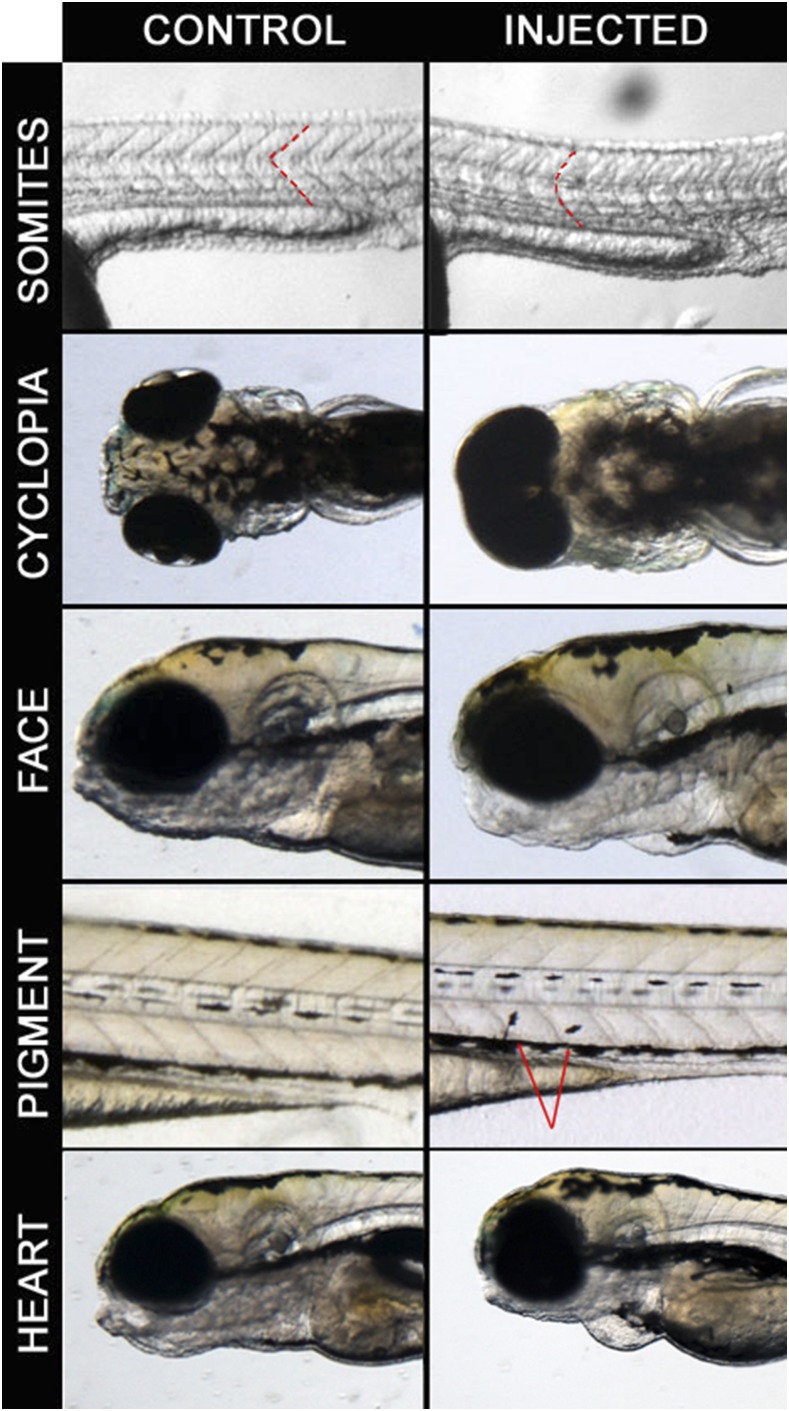
Figure 2.
Examples of phenotypes observed in the screen. Control embryos are on the left panel and injected embryos are on the right panel. Somites: RWDD2B 100pg injected embryos at 24 hpf with dashed lines to highlight somitic boundaries. Cyclopia: C21ORF84 100pg injected embryos at 5 dpf. Pigment cell migration: CCT8 100pg injected embryos at 4 dpf, arrows indicating melanocytes. Heart: JAM2 100pg injected embryos at 48 hpf.

