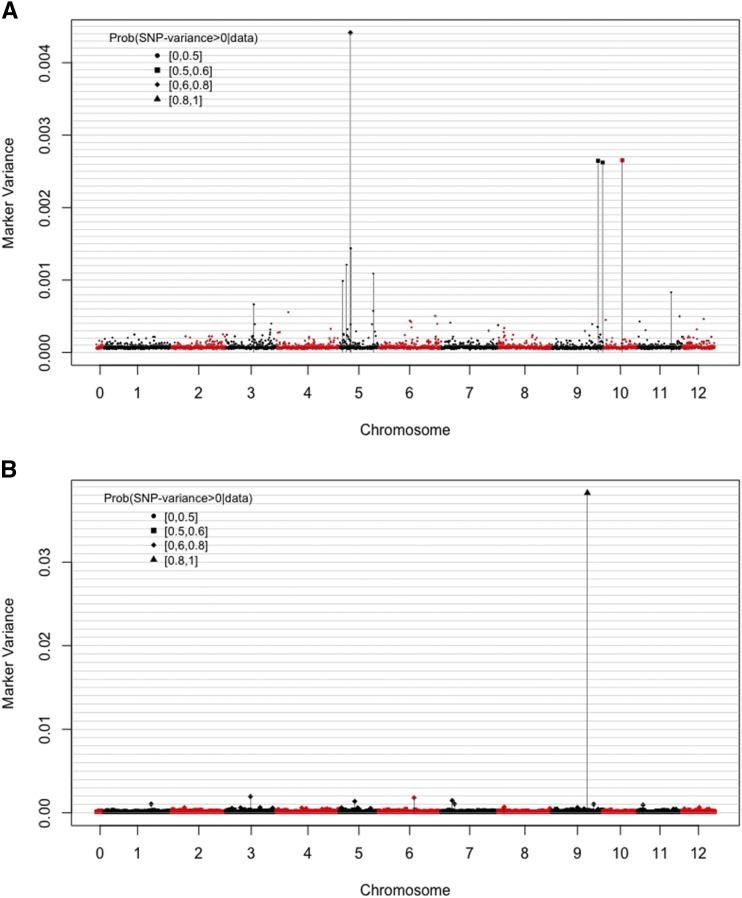
Figure 4.
Estimated SNP-variances derived from BayesB model using the additive model for late blight (A) and common scab (B). (In both cases, phenotypes were disease scores standardized to a variance equal to one. Vertical lines indicate the positions of the top-10, according to estimated SNP-variance markers).

